
PART 5
Work the neighborhood first, then the zip.
Here I stay at the neighborhood level long enough to understand who is operating there, then I widen out to the zip code. Along the way I add a minimum year built so new construction stops fooling me. Then I open the addresses, read the history and the mortgages, and pick up the listing agent.
Work the flips address by address.
Read what the single property result sold for.
This tells me people are operating there and they are familiar with that area. When I go to put something under contract, I already know what they buy and what they sell for.
Then I can call them and say, hey, would you be interested in this around this. That is how the reverse wholesaling conversation starts.
And I know that when I go to put something under contract, I could just go I can just look at what they bought and sold for.
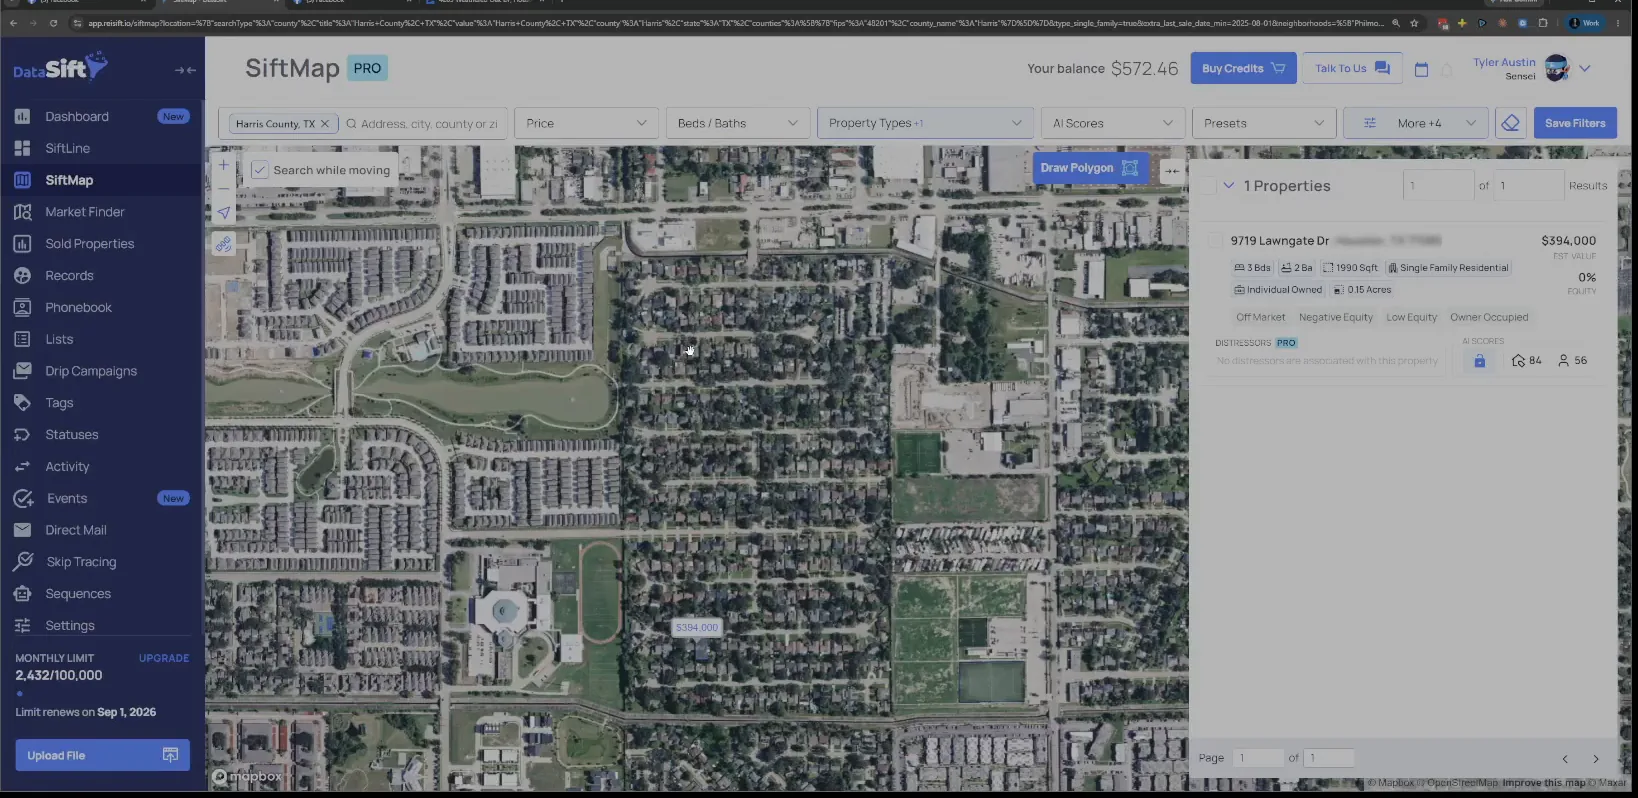
Keep the map on the neighborhood with three results.
The right panel is holding three properties inside Harris County. That is the neighborhood level, and it is where I want to read first.
I prefer personally to stay inside the neighborhood level before I widen anything out.
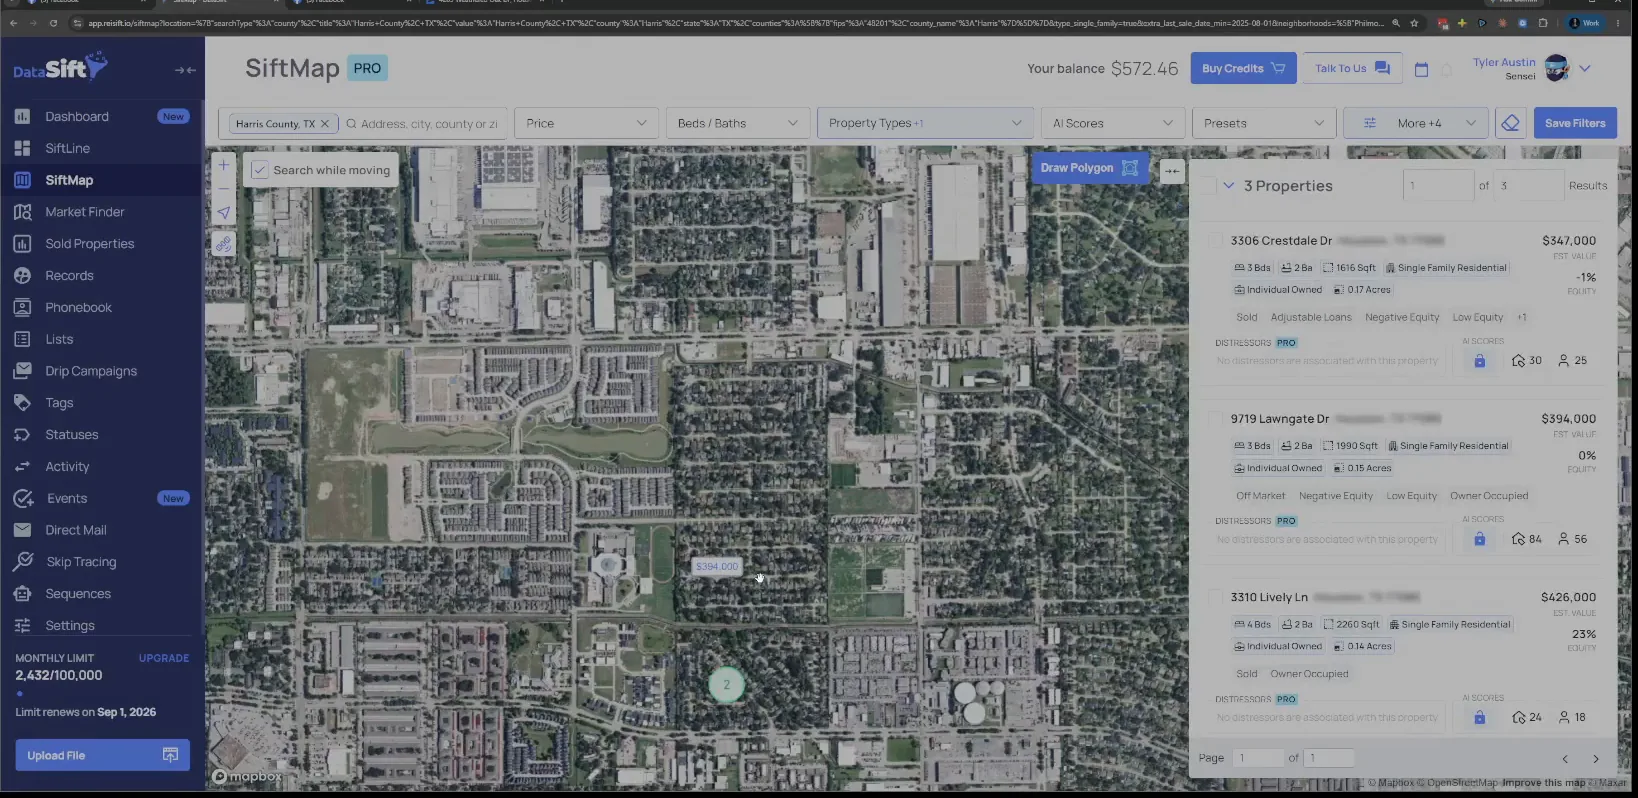
Switch to satellite view over the same three results.
Satellite shows me the cluster and what sits around it while the results panel loads. I stay inside the neighborhood level until I have understood the area.
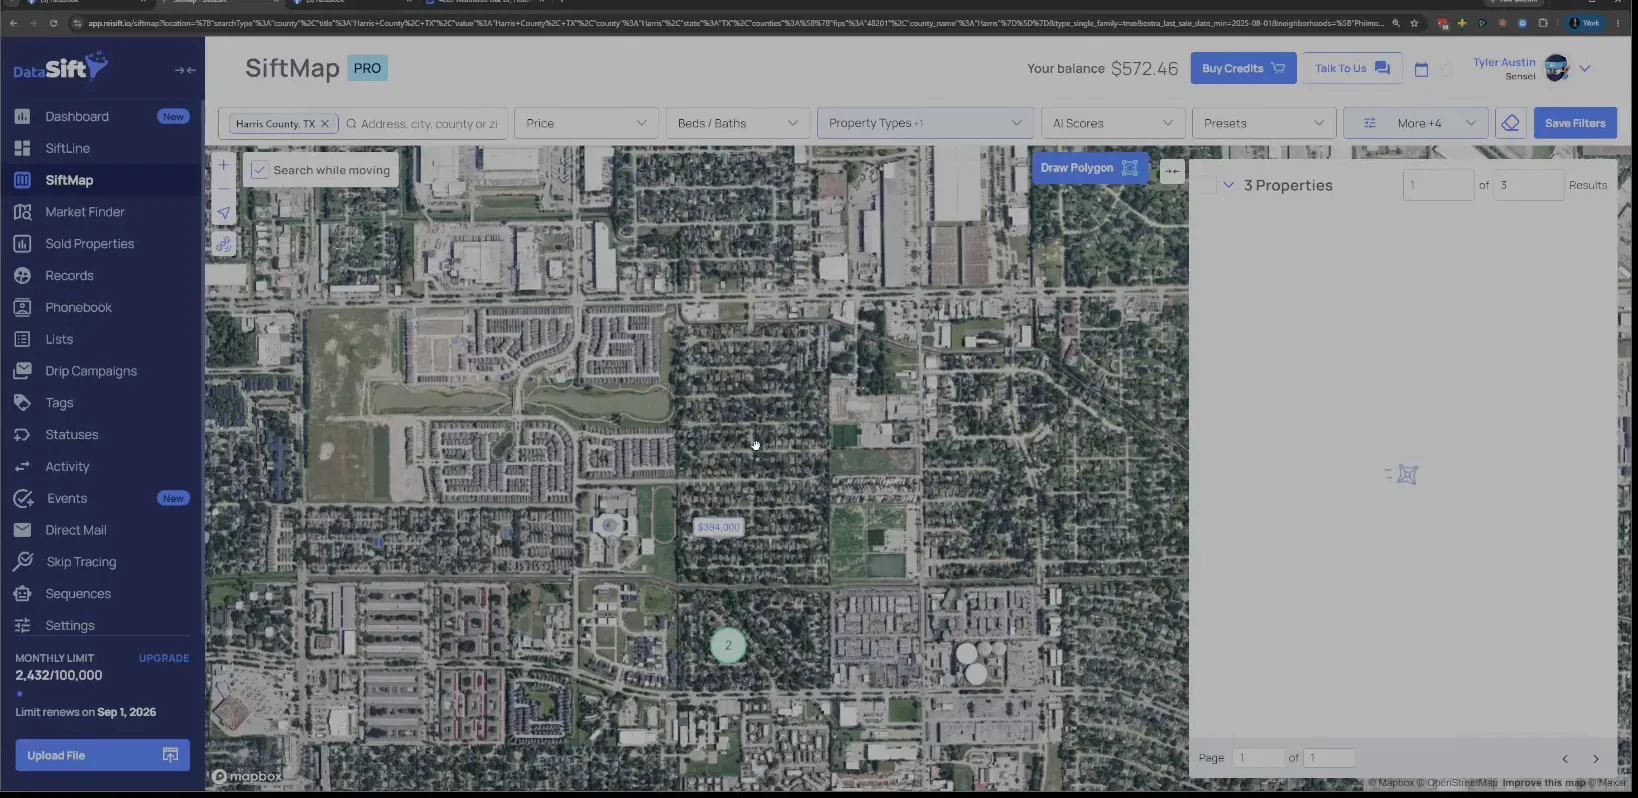
Read the price labels on the three neighborhood results.
With the labels on the map I can see what each one went for without opening anything. If you were doing zip code level, you would not notice and see some of these issues.
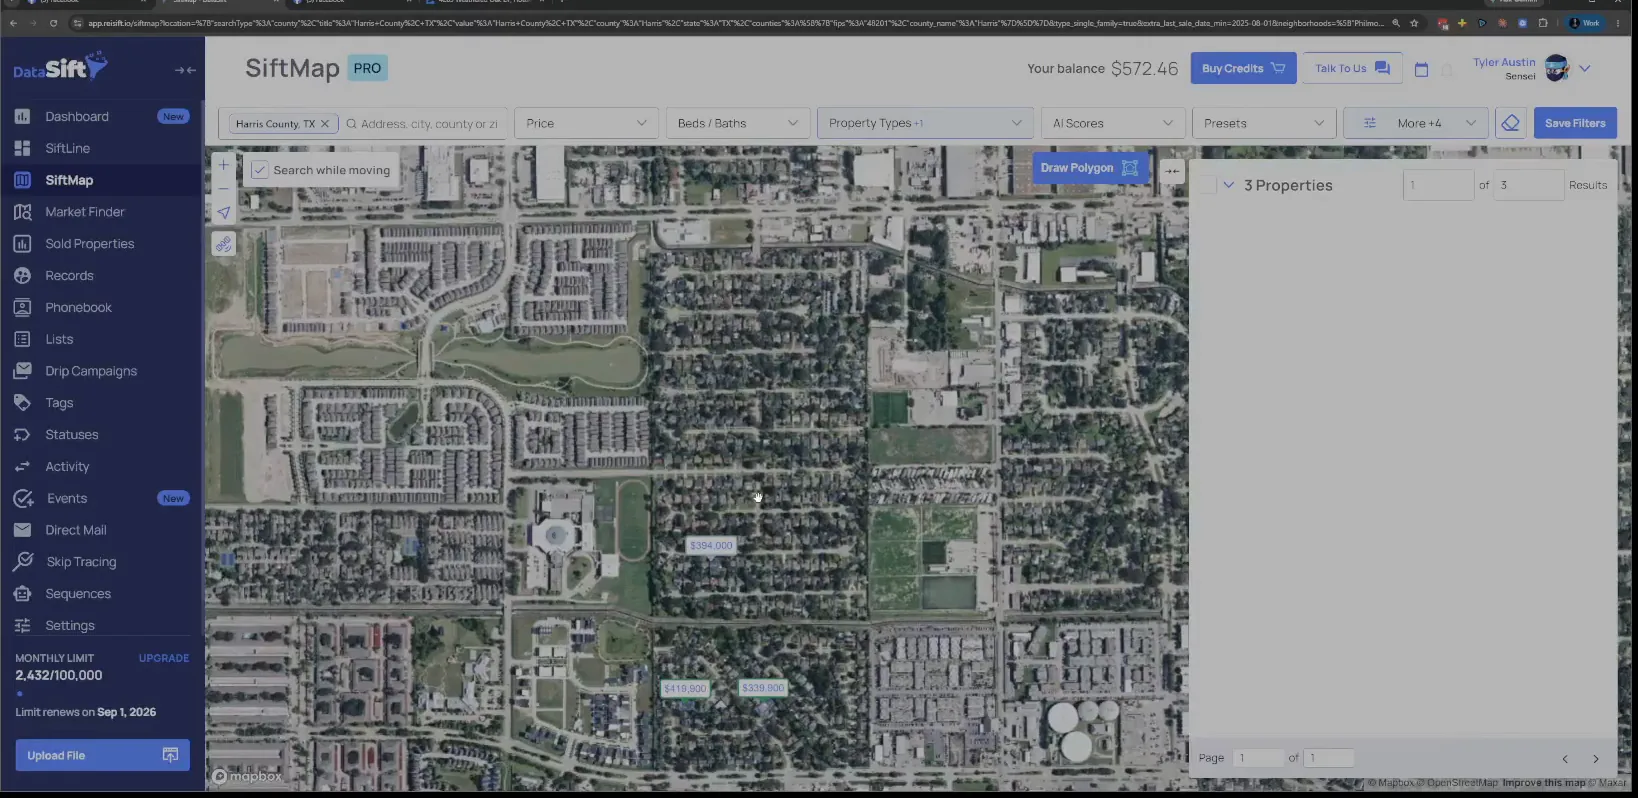
Compare the sale prices shown on the map pins.
The satellite view puts the sale prices right on top of the houses. Side by side like that, I can tell which street is doing what.
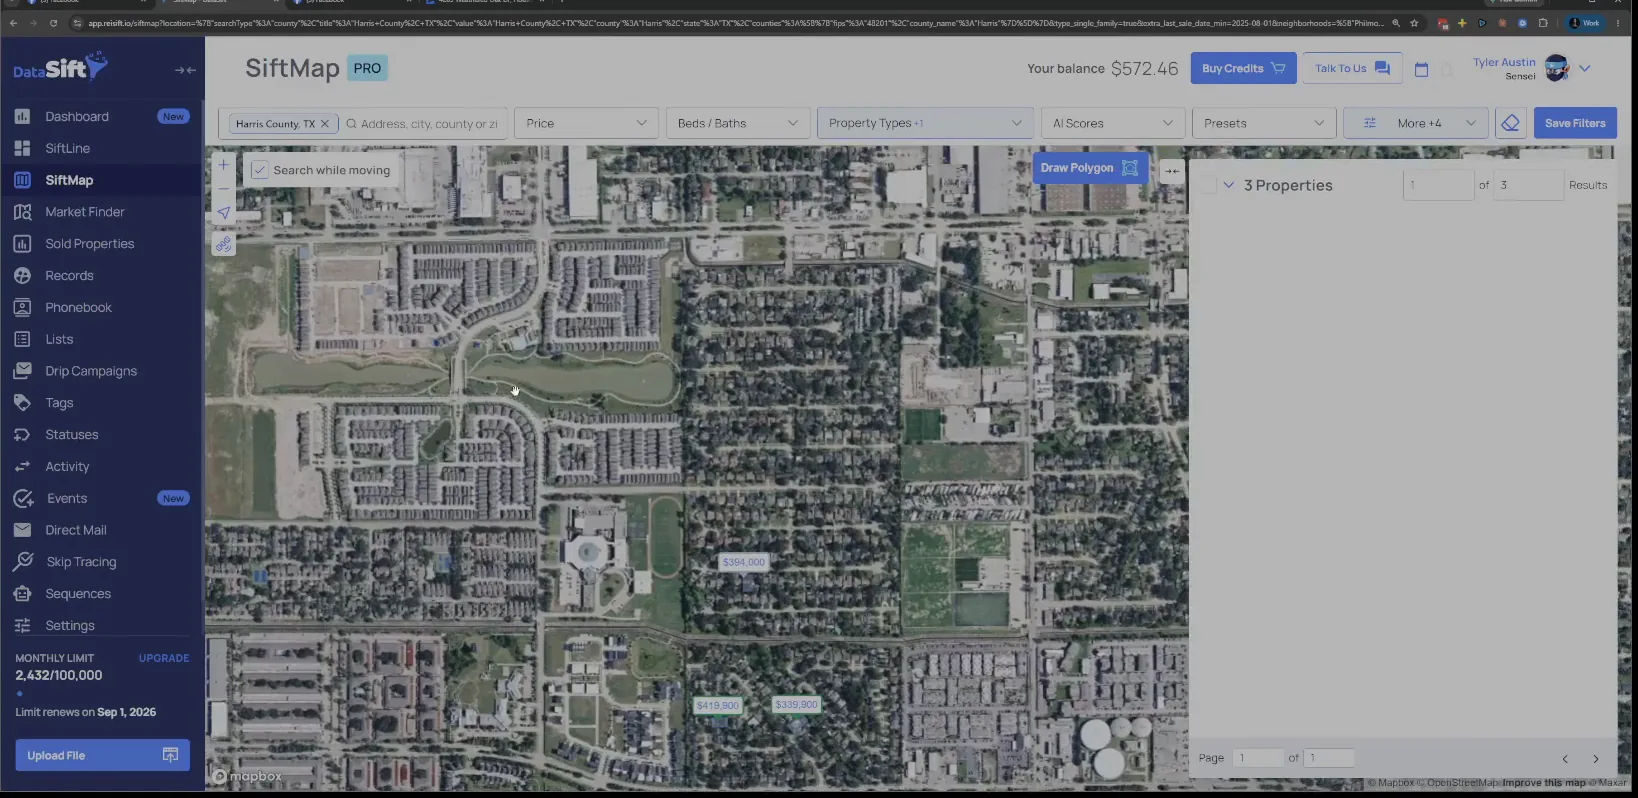
Click the property card to open its stats.
On screen the card is showing the price and the basic stats, nothing expanded yet. That summary is the first read before I go deeper on the address.
New construction pockets are the thing I am watching for here. So I like to stay at that neighborhood level first, and then work out from there.
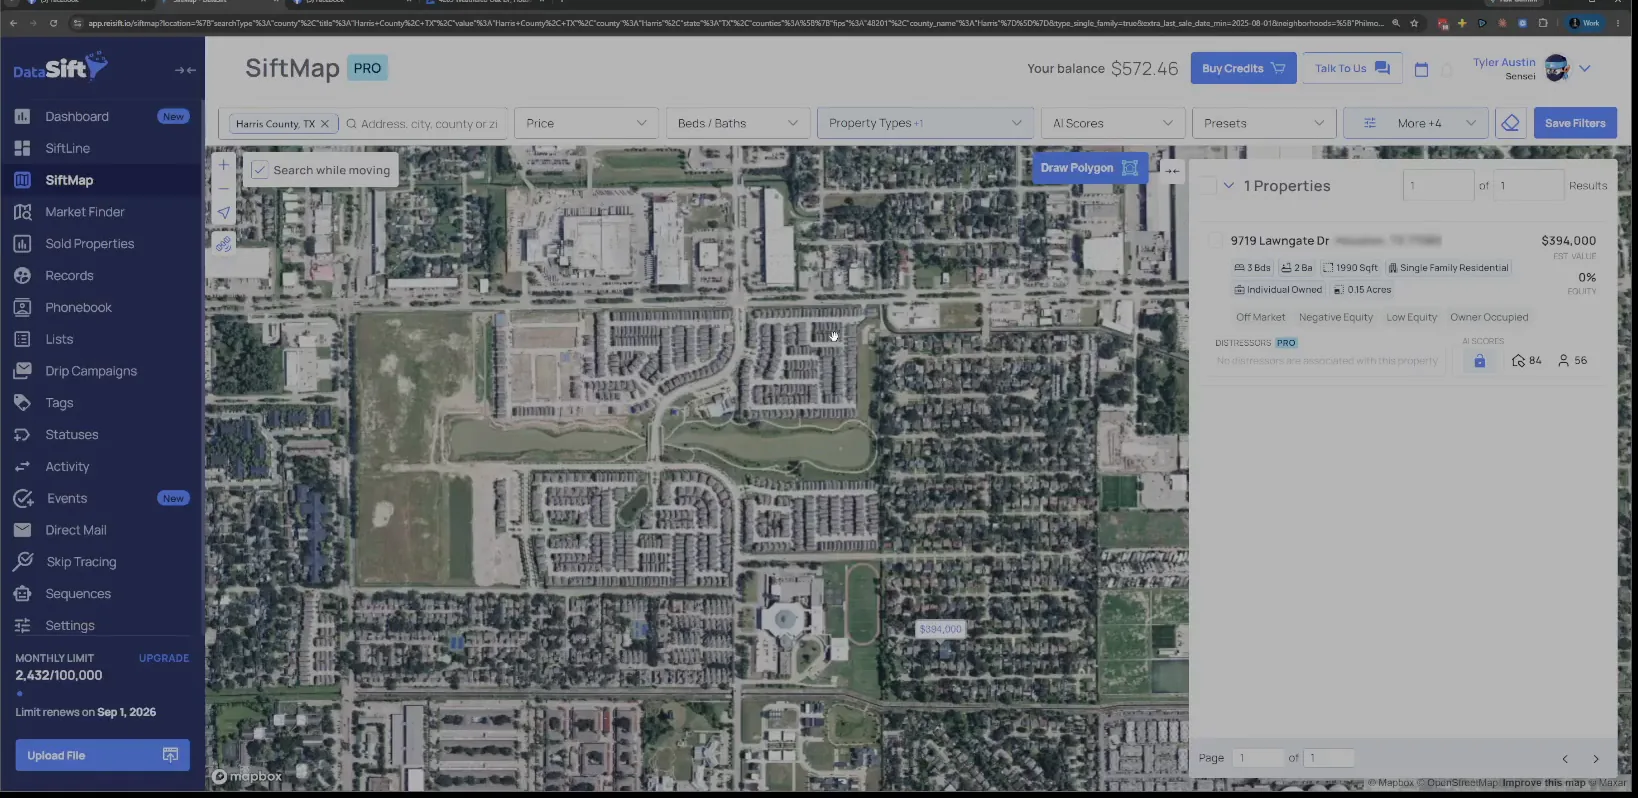
Keep the neighborhood filter on while you widen out.
The map is still holding the three properties with the neighborhood filter applied. Now that I understand the area, another thing I can do is a minimum year built.
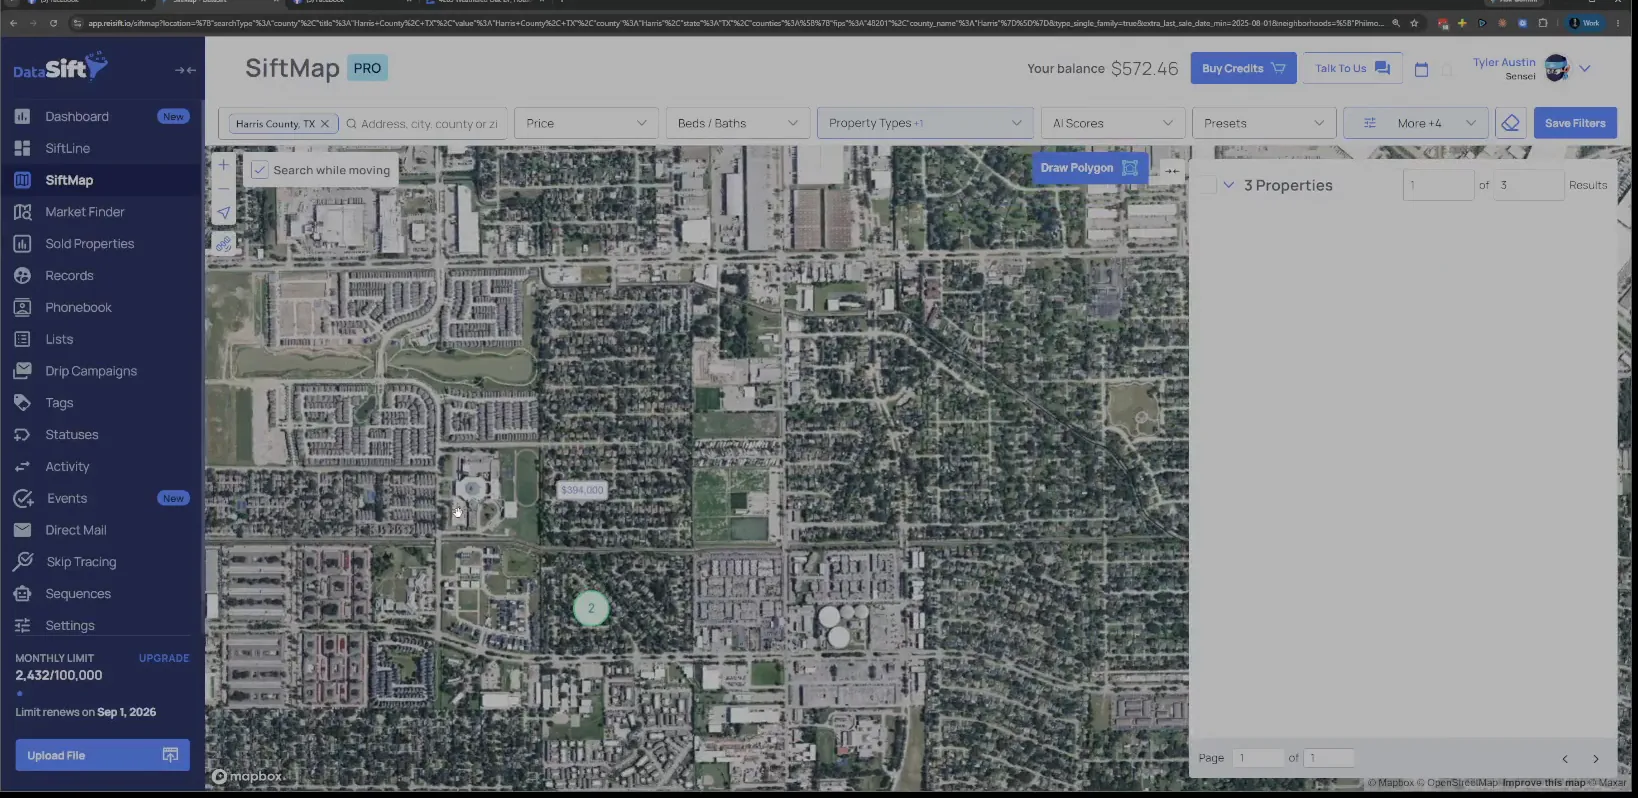
Set the Year built minimum to twenty ten under Property Details.
The min and max fields sit empty in More filters until I fill them. I want properties that are at least twenty ten and older.
That gets rid of any of those potential false positives of a newer house being bought and sold.
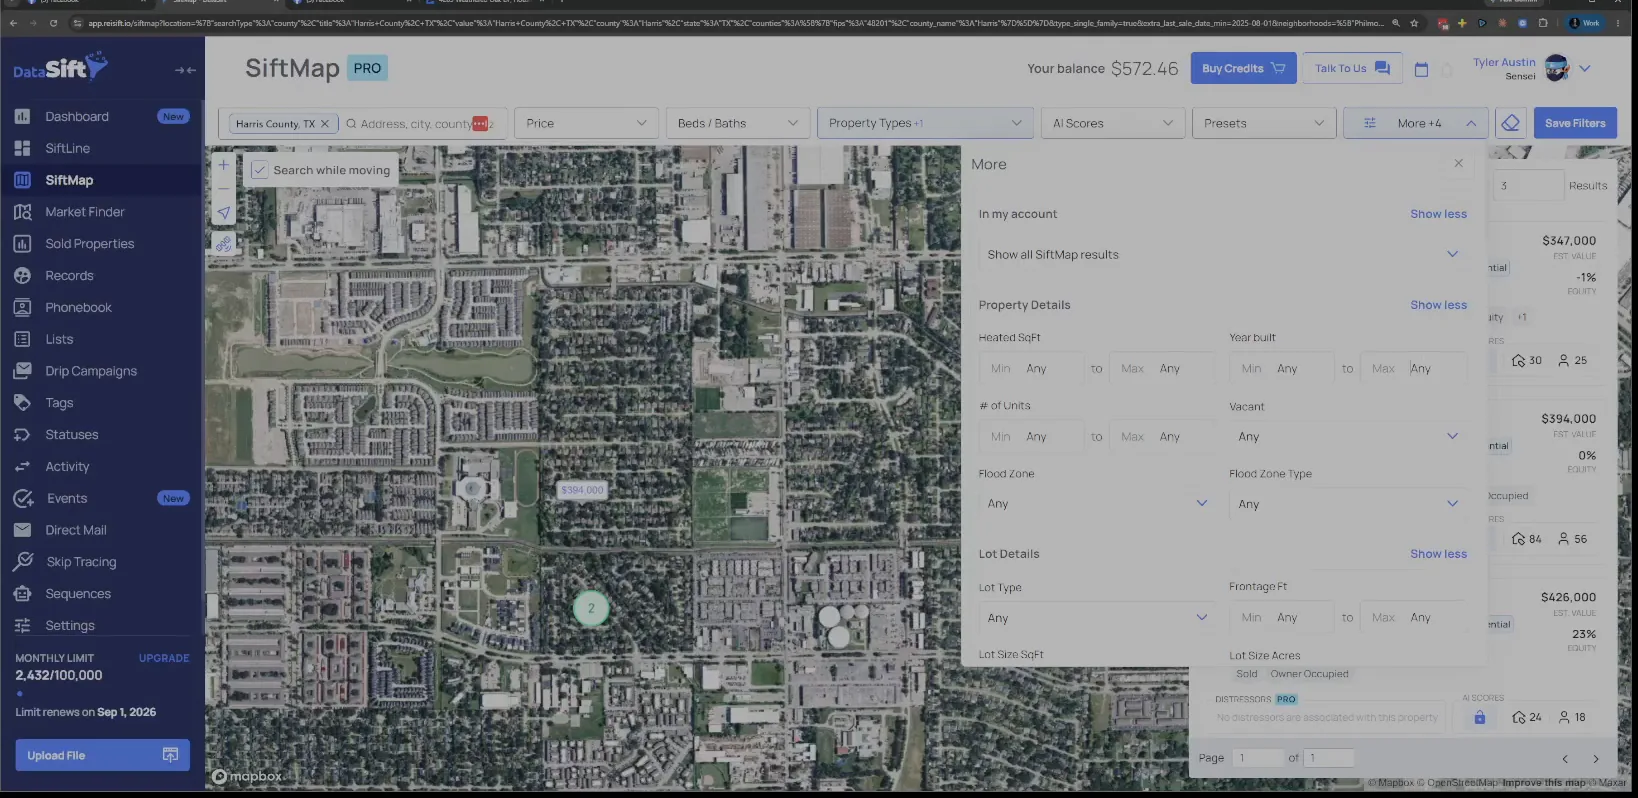
Find the neighborhood tag in the Advanced Geography panel.
Advanced Geography is still carrying the Philmont Dr. TX neighborhood while the map holds those results. That tag is the one I remove so I can go to the zip code level.
I grab one of these zip codes first, then take the neighborhood off. Everything else in the filter I keep.
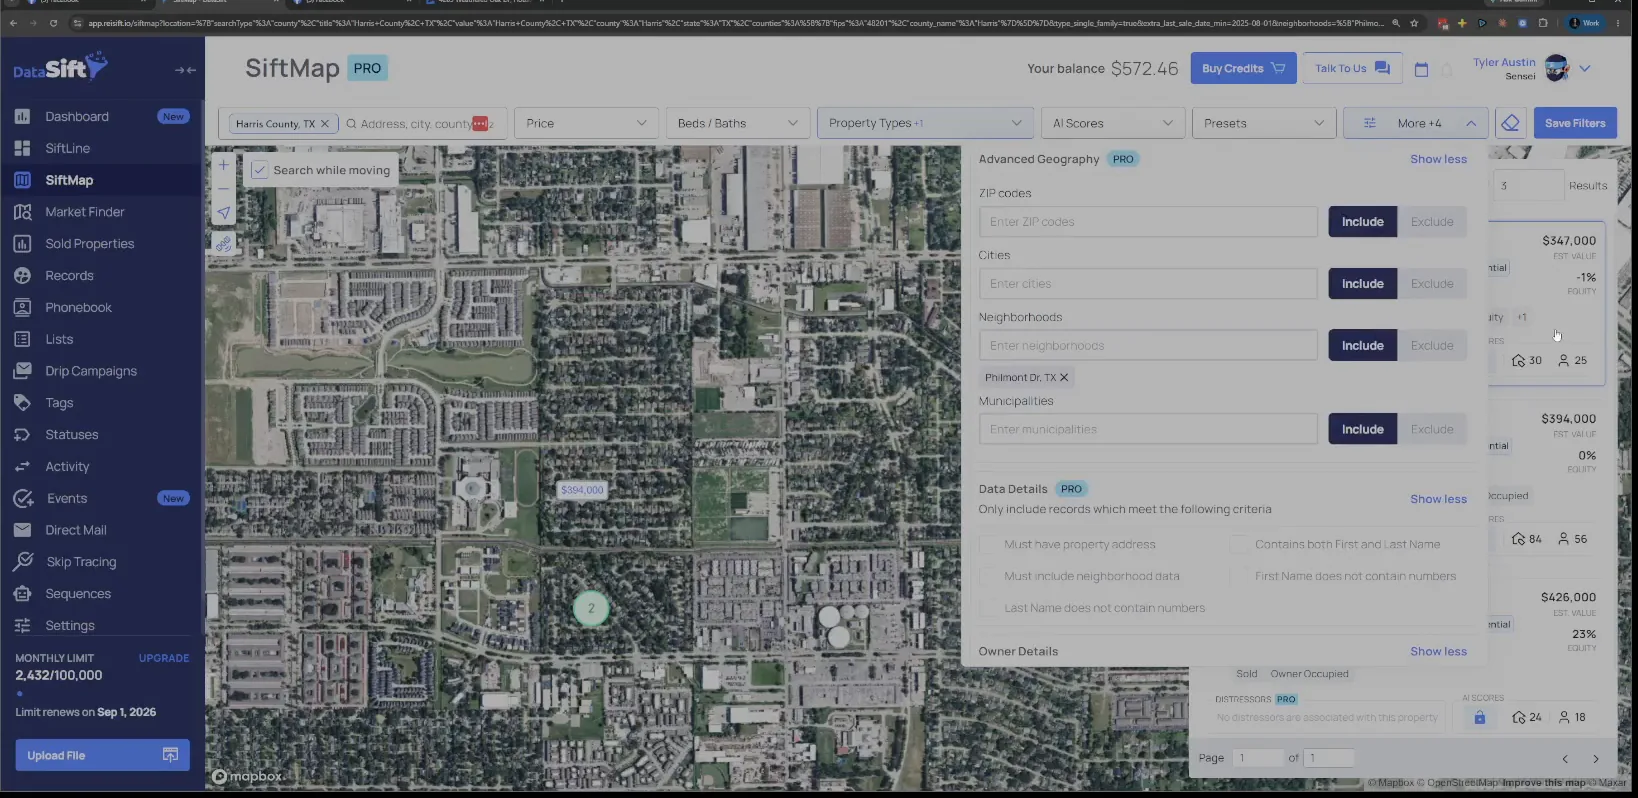
Open the Last Sold Date calendar with Flip still set.
The calendar is open in the filter panel and the investor transaction type next to it is Flip. This is where I bring the date back to January.
Then I click apply and zoom out. Flip stays selected, so what comes back is flippers only.
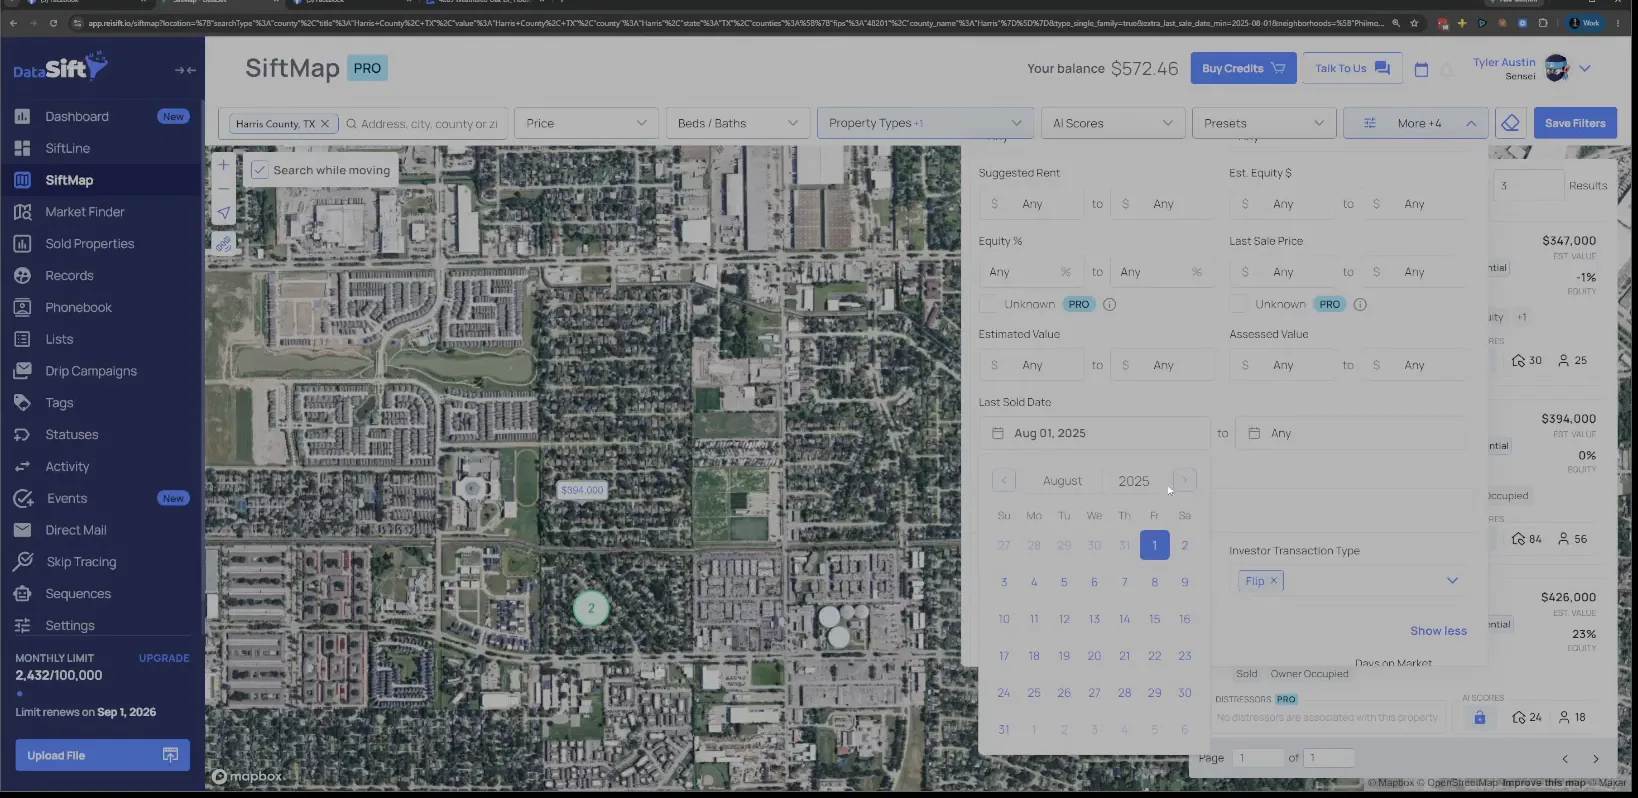
Zoom out and count the flip results on the map.
Zoomed out I can see flippers bought and sold since January. The price markers spread across the whole area instead of one street.
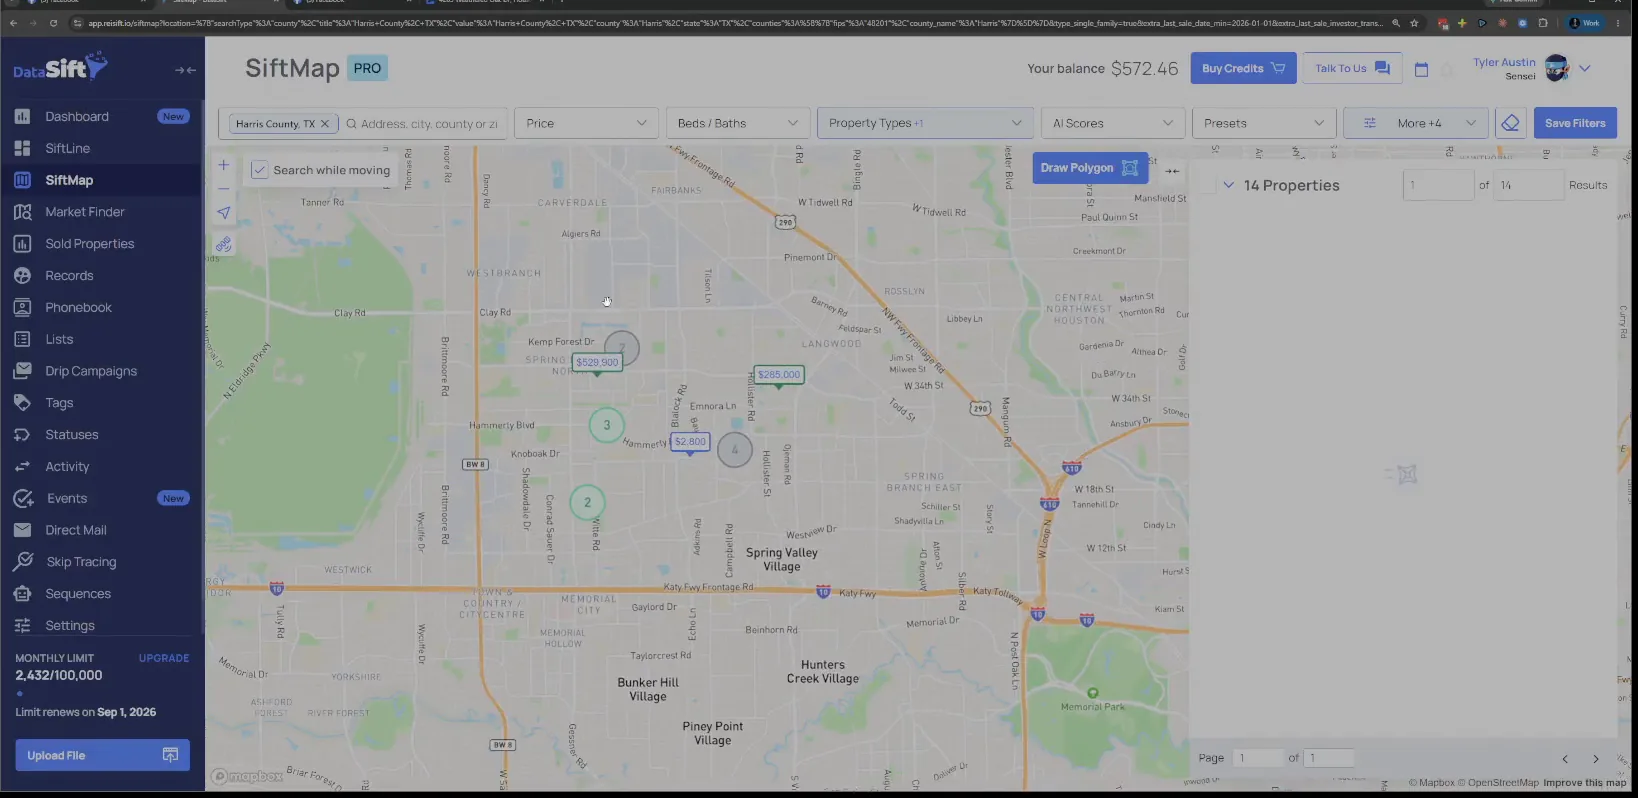
Confirm the zip code sits in the geography field.
The geography is on the zip code now and the count is still holding. So not too bad.
Preferred approach
Neighborhood first, then the ZIP, then the agent.
- 1Stay at the neighborhood levelWork the people inside the neighborhood first so you catch the new construction pockets.
- 2Add a minimum year builtSet a minimum year built to cut the false positives of a newer house being bought and sold.
- 3Go to the zip code levelGrab the zip code, remove the neighborhood, apply, and zoom out to see the flippers.
- 4Open the addresses and historyOpen each address, look at the history, and watch for those double closing type situations.
- 5Look at your mortgagesIn a non disclosure state the sales prices are never right, but the loan amounts are pretty accurate.
- 6Call the real estate agentSkip the entity and build the relationship with the agent who listed the flip.
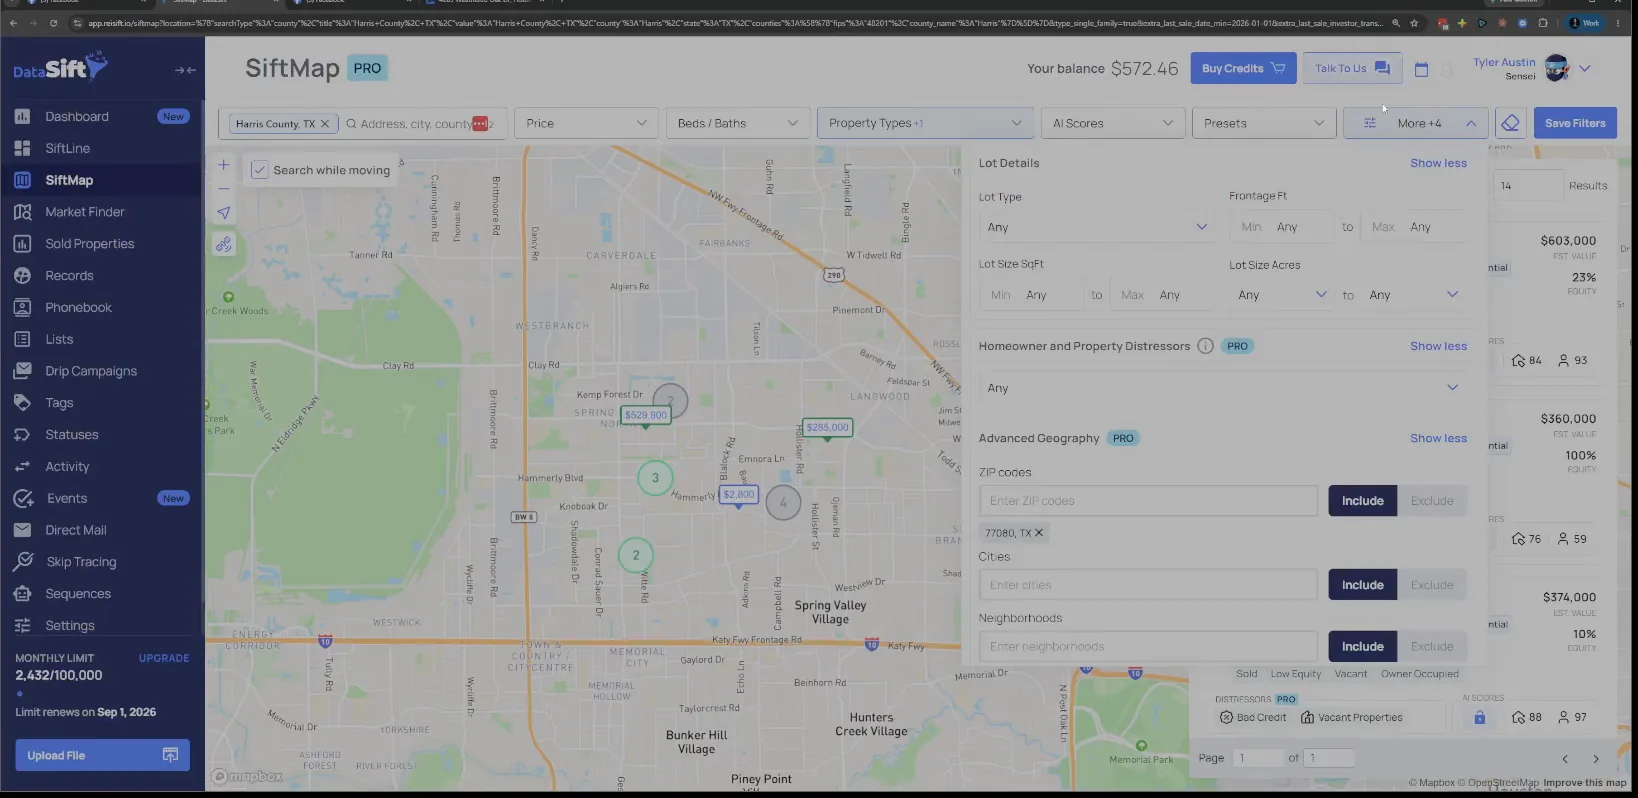
Work your mile radius list before this zip code list.
We can work with that. I already have the people around the deal itself, so those get called first.
Then I go out to the zip code level and start looking at these.
And we already know that in our neighborhood that our deal was in, okay, I already got a list of people within a mile radius of that deal.
Open the addresses one at a time from the results.
The zip code map is showing the flip properties in price clusters. I open up the addresses and go look at my history on each one.
Note the listing agent on the property details panel.
The panel shows the sold status and the agent name, Adrienne Oliver, with the history tab open. That agent name is what I am really here for.
There is zero reason to go build a relationship with the entity. This agent knows other buyers and already has a relationship with this one.
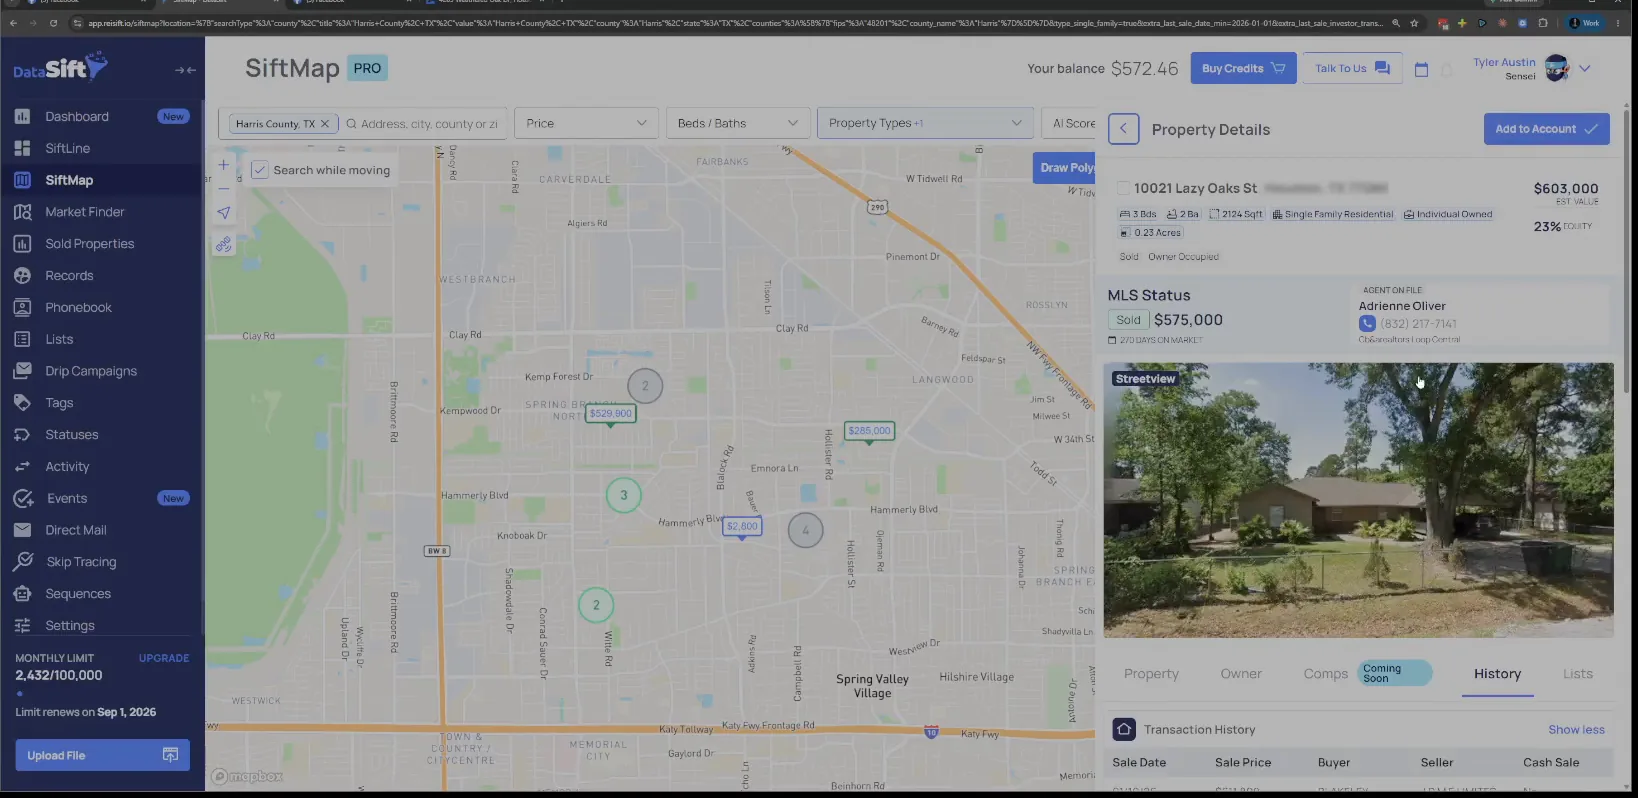
Open the Transaction History tab on that address.
The tab lists the sale dates, the prices, the buyers and the sellers. I do the same exact thing on every address I open.
The big thing is you want to look at the potential for those double closing type situations, because there could be opportunity there.
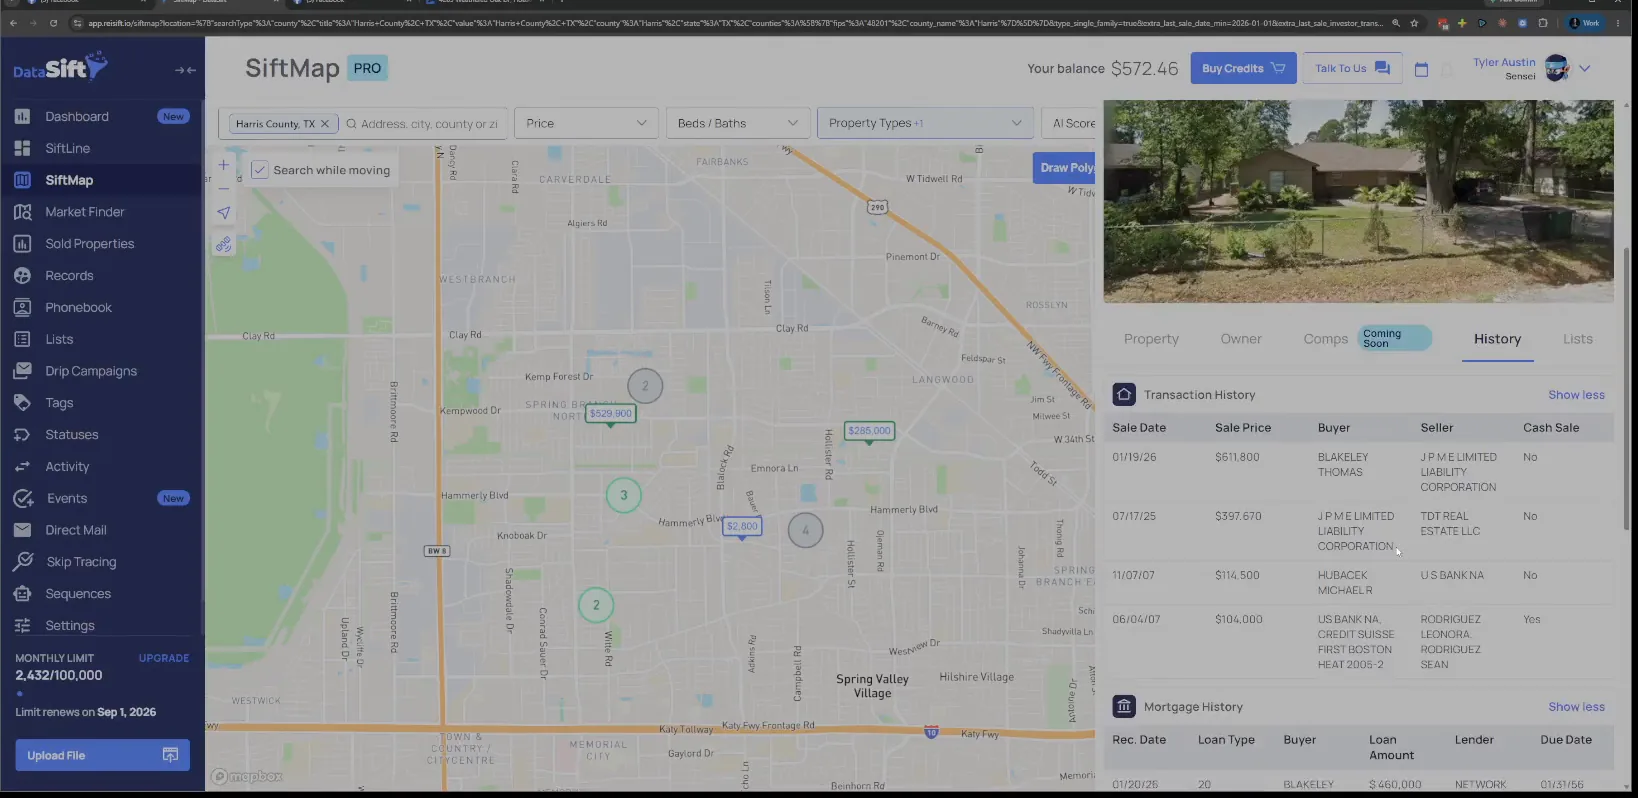
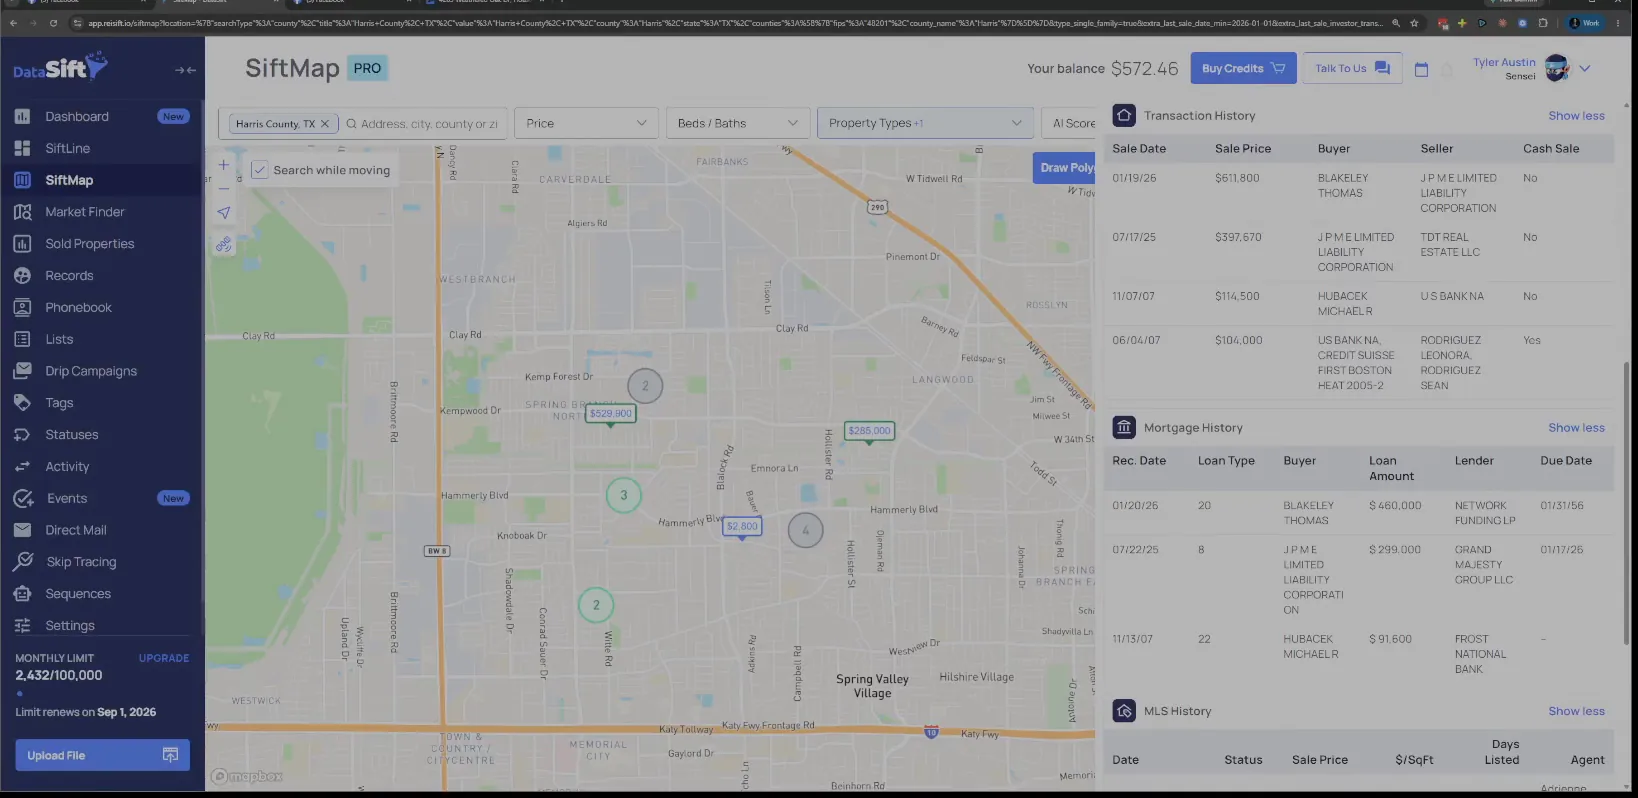
Read the mortgage amount next to the business buyer.
Mortgage History sits under the transactions with the buyer and the loan amounts. In your non disclosure states you cannot trust these sales prices. They are never right in Texas, but your loan amounts are going to be pretty accurate.
That loan amount often includes rehab, so you kind of know how much that property really was bought for. The business bought it and sold it, and the loan tells me the real number.
Adrian Oliver is someone who knows them, so I grab that name. Just call the agent and skip the corporate skip tracing.
BEFORE YOU MOVE ON