
PART 2
Start with the neighborhood the deal sits in.
This is where I start on a deal I am trying to dispo. I pull the neighborhood name off the record, filter the map down to that neighborhood, and work out the turnover rate. Then I look for flips and find out who the flipper was.
The neighborhood name comes from land details.
Open the address search bar above the More filters panel.
If you already have a deal that you're trying to dispo, you're going to search the address of it. The filters panel is open here with Property Details and Lot Details showing, and the county is already set in the bar at the top.
So the first move is just typing the deal address into that search bar.
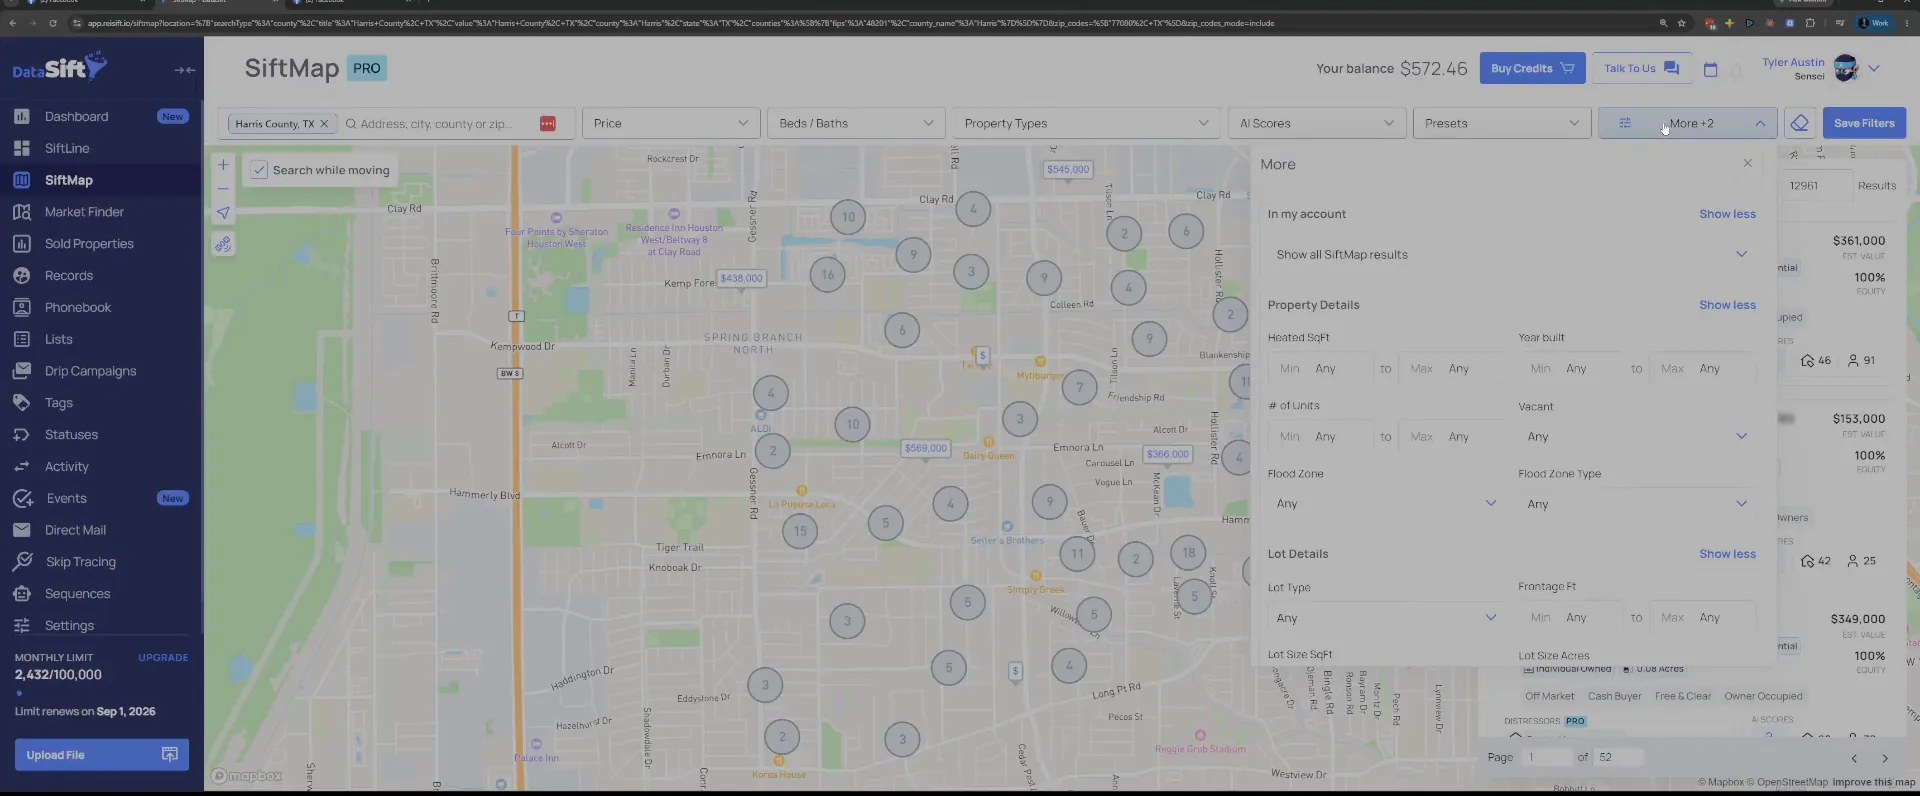
Search the deal address and open its property record.
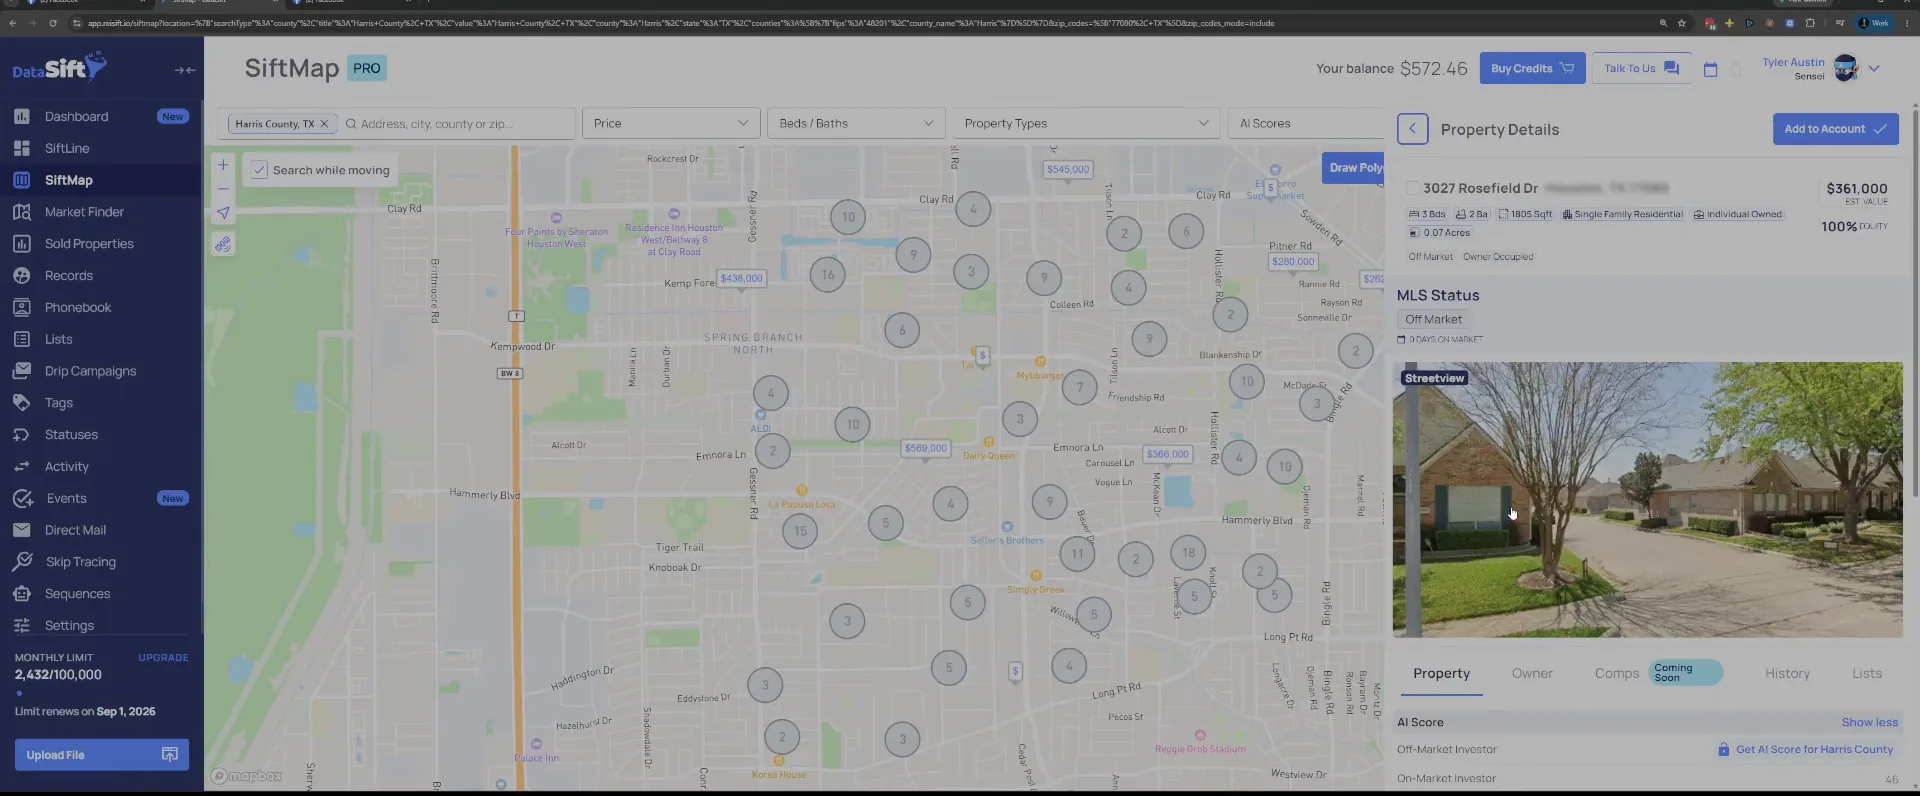
The record opens with the address, the MLS status and a streetview picture of the house. That confirms you are on the right property before you go digging.
From here I go down to the land details on this same panel.
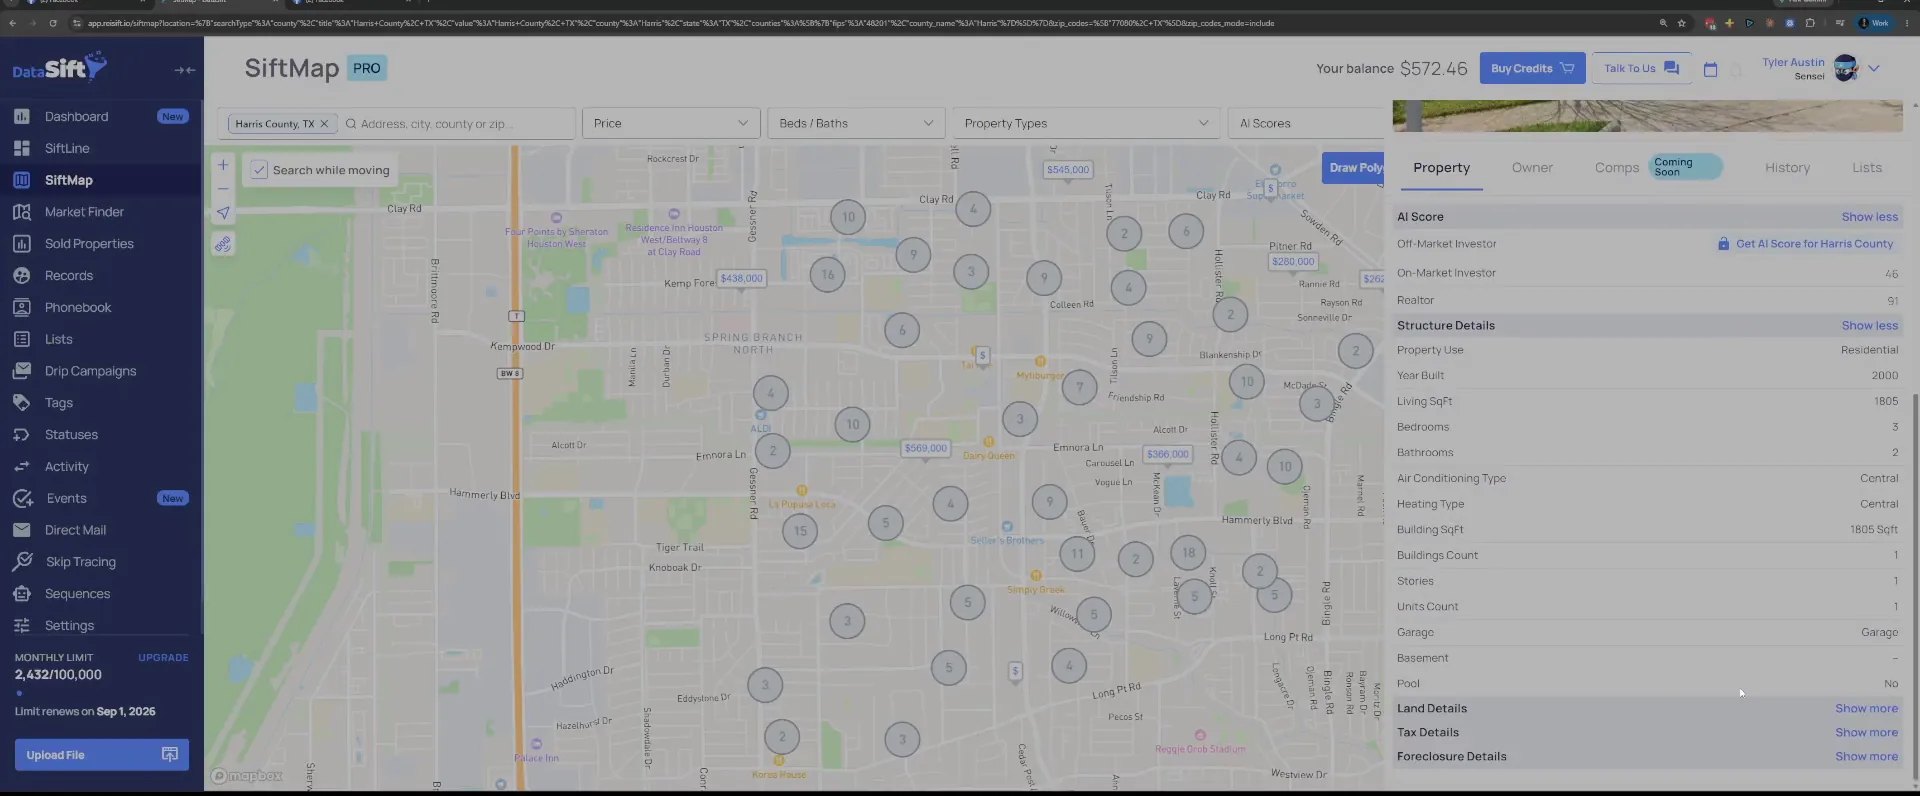
Scroll to Land details and click show more.
The panel is showing the structure details, with the Land Details section still collapsed under them. The show more link is what opens it.
That's going to give you the neighborhood name.
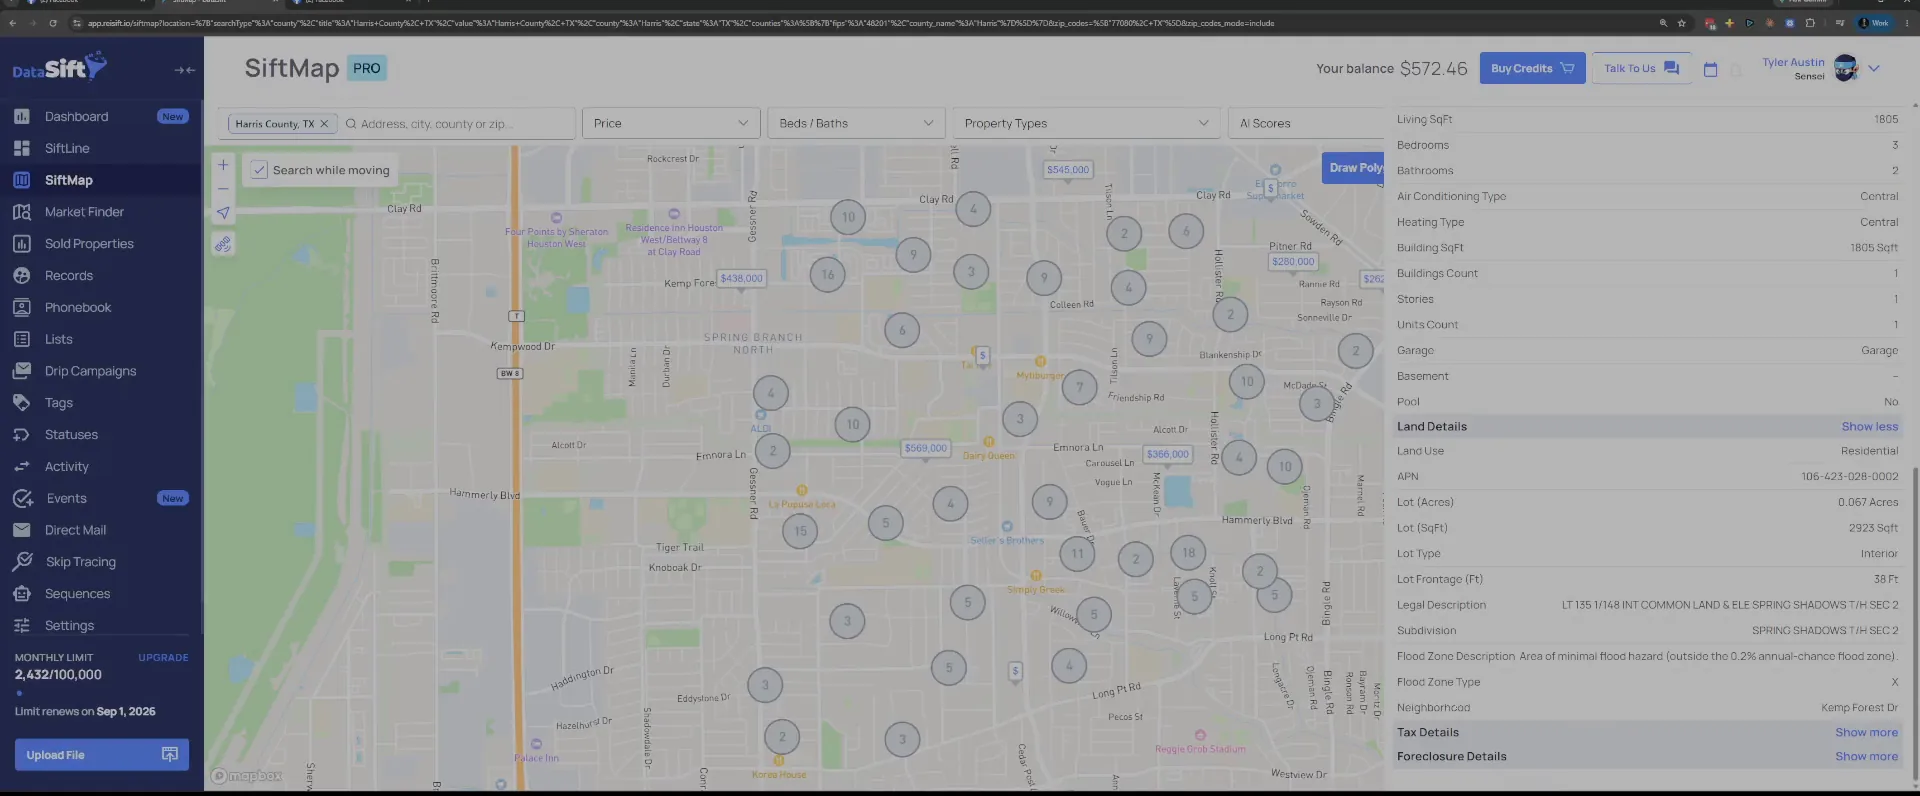
Copy the Neighborhood value from the expanded Land details.
Land details opens up and down here you see neighborhood. It reads Kemp Forest Dr, so I'm just going to grab that.
Then underneath my more filters, I'm going to go to neighborhoods and paste that neighborhood in there. That's just going to get me down to the neighborhood that deal's in.
Click apply on the Neighborhoods filter.
The map and the list redraw to just the Kemp Forest neighborhood. Everything else in the county drops off.
That's kind of where I start on any deal I'm trying to place.
Read the property count above the neighborhood list.
You got 1,400 properties inside this neighborhood. That total is the bottom of the math I'm about to do.
Next I look out the last twelve months to see how many of them have sold.
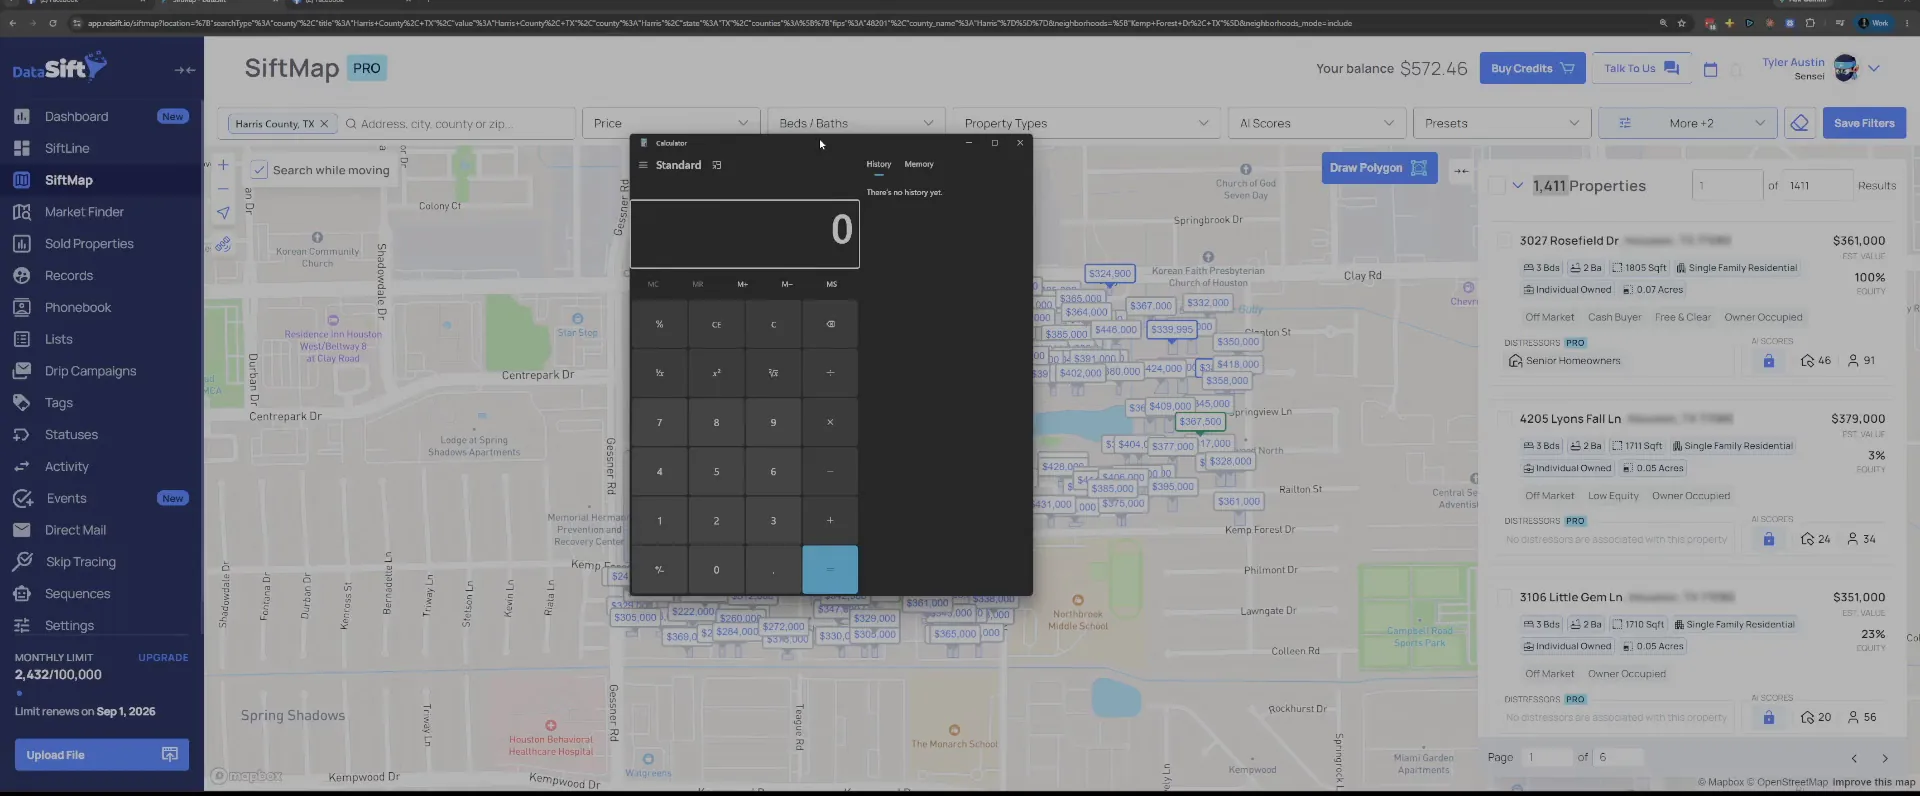
Open the calculator next to the neighborhood list.
Sold in the last twelve months over the total gives us a turnover rate. We got 1,400 total properties period, so that's the number I divide into.
So let's just now look at the sold properties in the last twelve months.
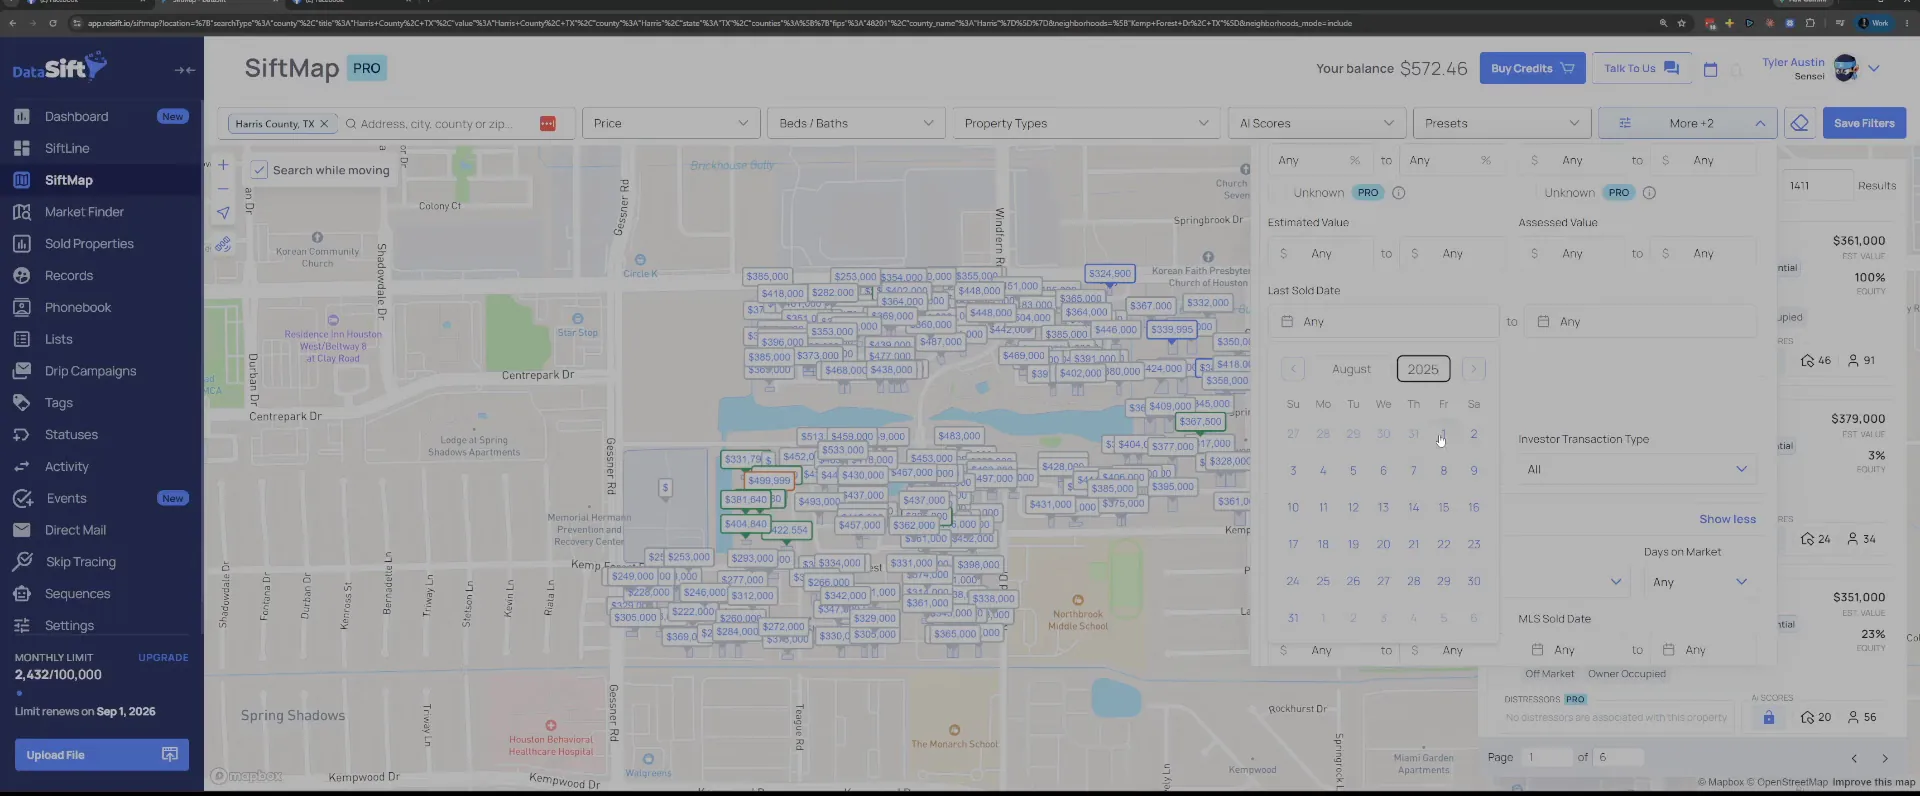
Set Last sold date to August 1, 2025.
The calendar opens in the filters panel on August 2025. Going back to August 1 gives me the last twelve months of sales in this neighborhood.
Then click apply.
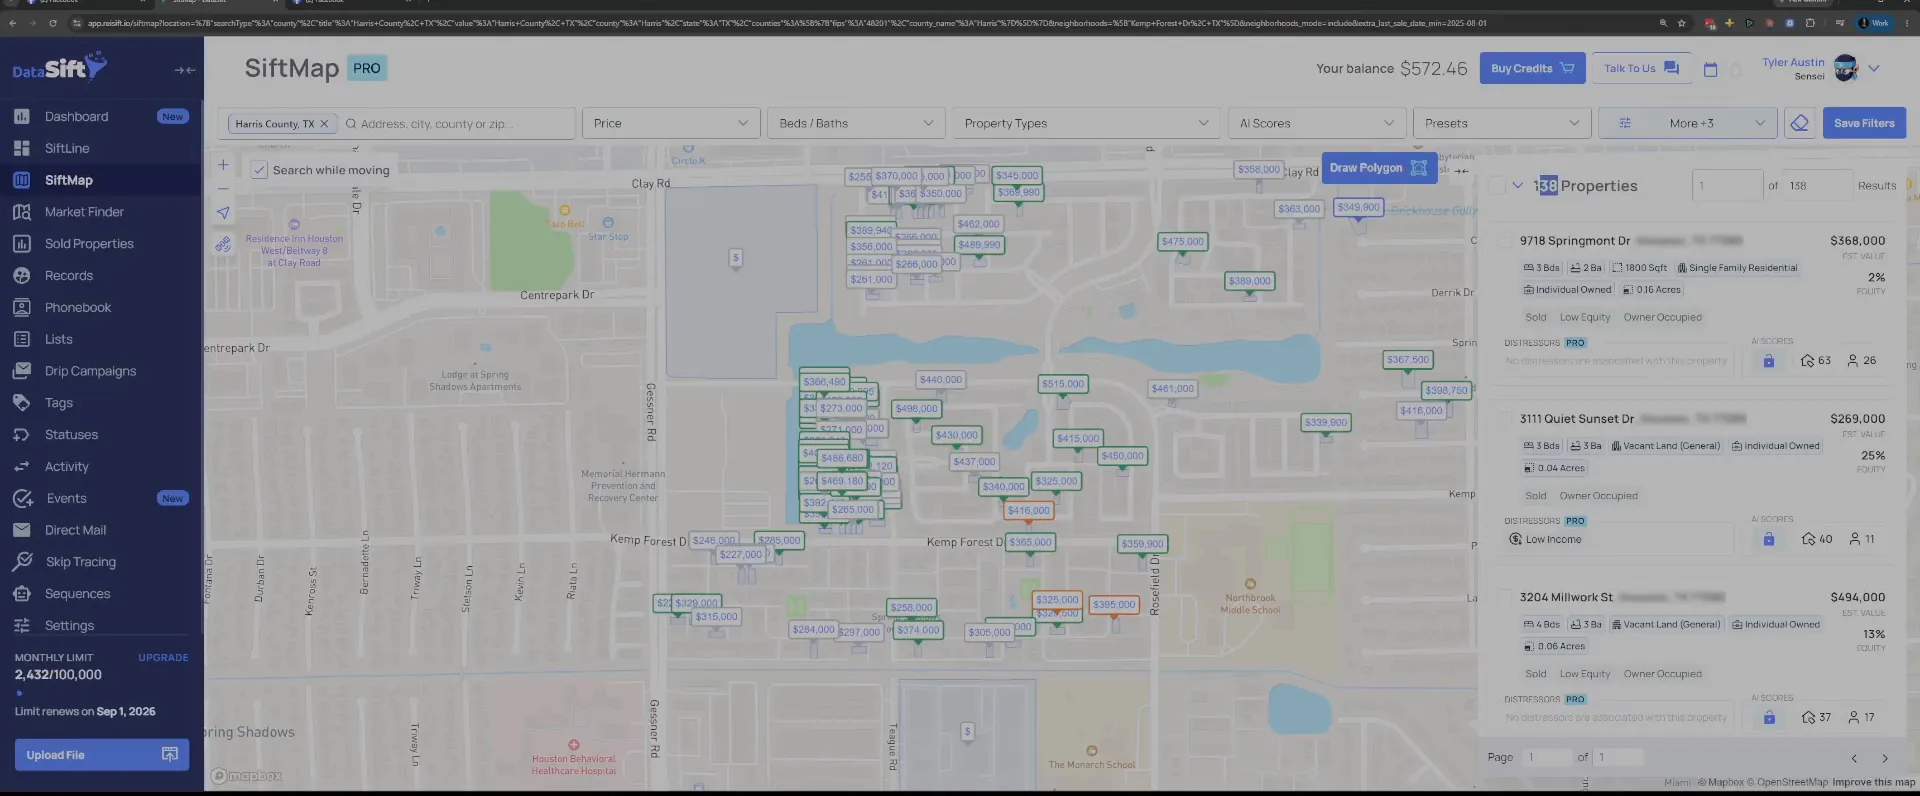
Read the sold count after applying the date.
We've had a 138 properties that have sold. So 138 divided by 1,400 gives us nearly a 10% turnover rate.
So it would be assumed that at a 10% turnover rate in neighborhood, there should be flips that have happened here.
Turnover math
The neighborhood turnover rate is nearly 10%.
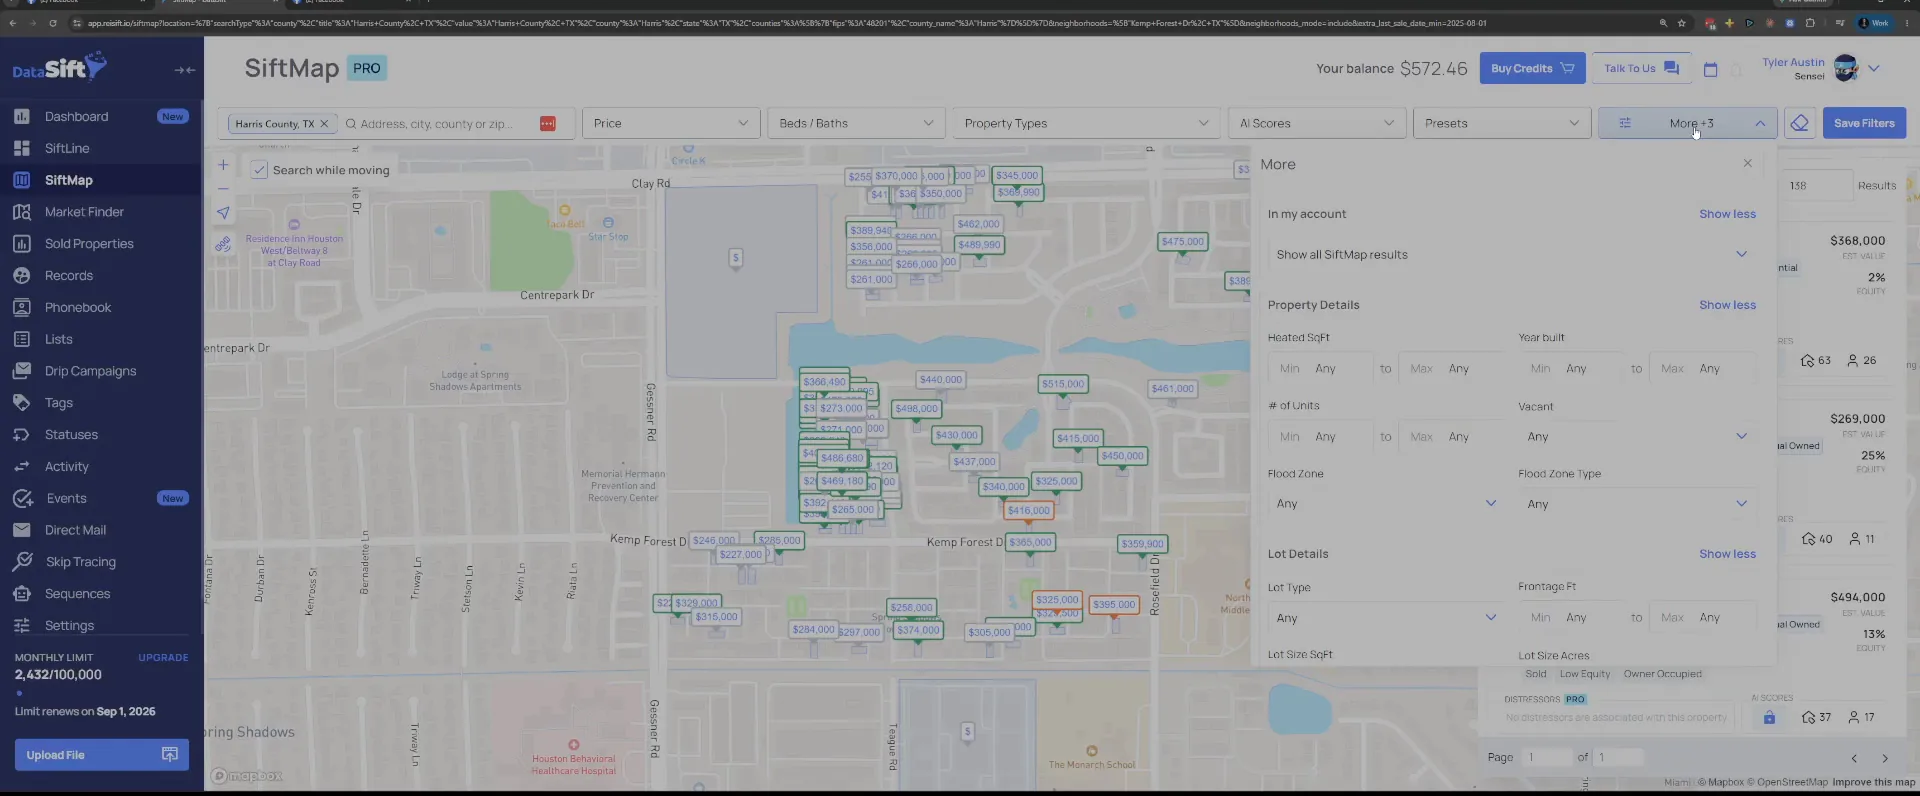
Go back to More filters with Property Details showing.
There should definitely be some flips that have happened here and some investment activity. What we don't really know at this very moment is, is this a flipper neighborhood or is this a buy and hold investor neighborhood.
So the next few picks in this panel are what answer that.
Go to Property types with the neighborhood list still showing.
The map and the property cards on the right are still the whole neighborhood, and property types has nothing picked yet. We're doing this as a team on our leads before we put things under contract, just to know.
Whenever we're doing marketing I already do my market analysis, and I find the neighborhoods that match these criteria. If I have investor activity here, then I'm going to start farming these 1,400 properties.
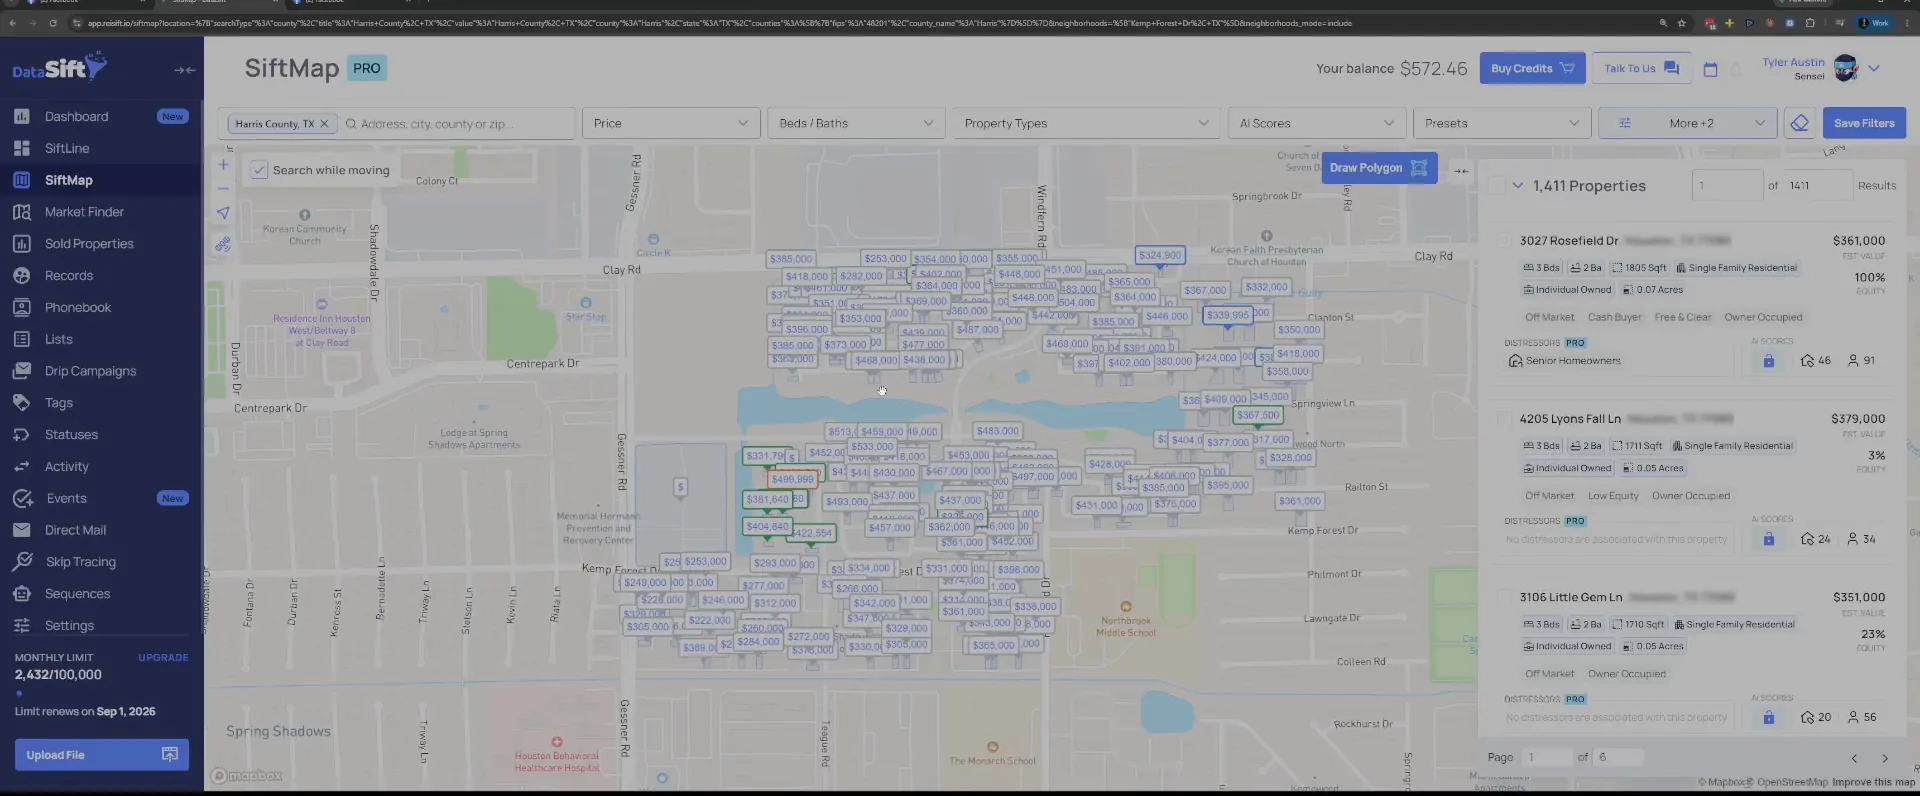
Switch Property types to single family residence.
That removes some properties off the list, because we're going to assume I have only single families. The count on the list comes down and the price markers thin out.
So now I have the county, I have the single family residence, and then I have the neighborhood.
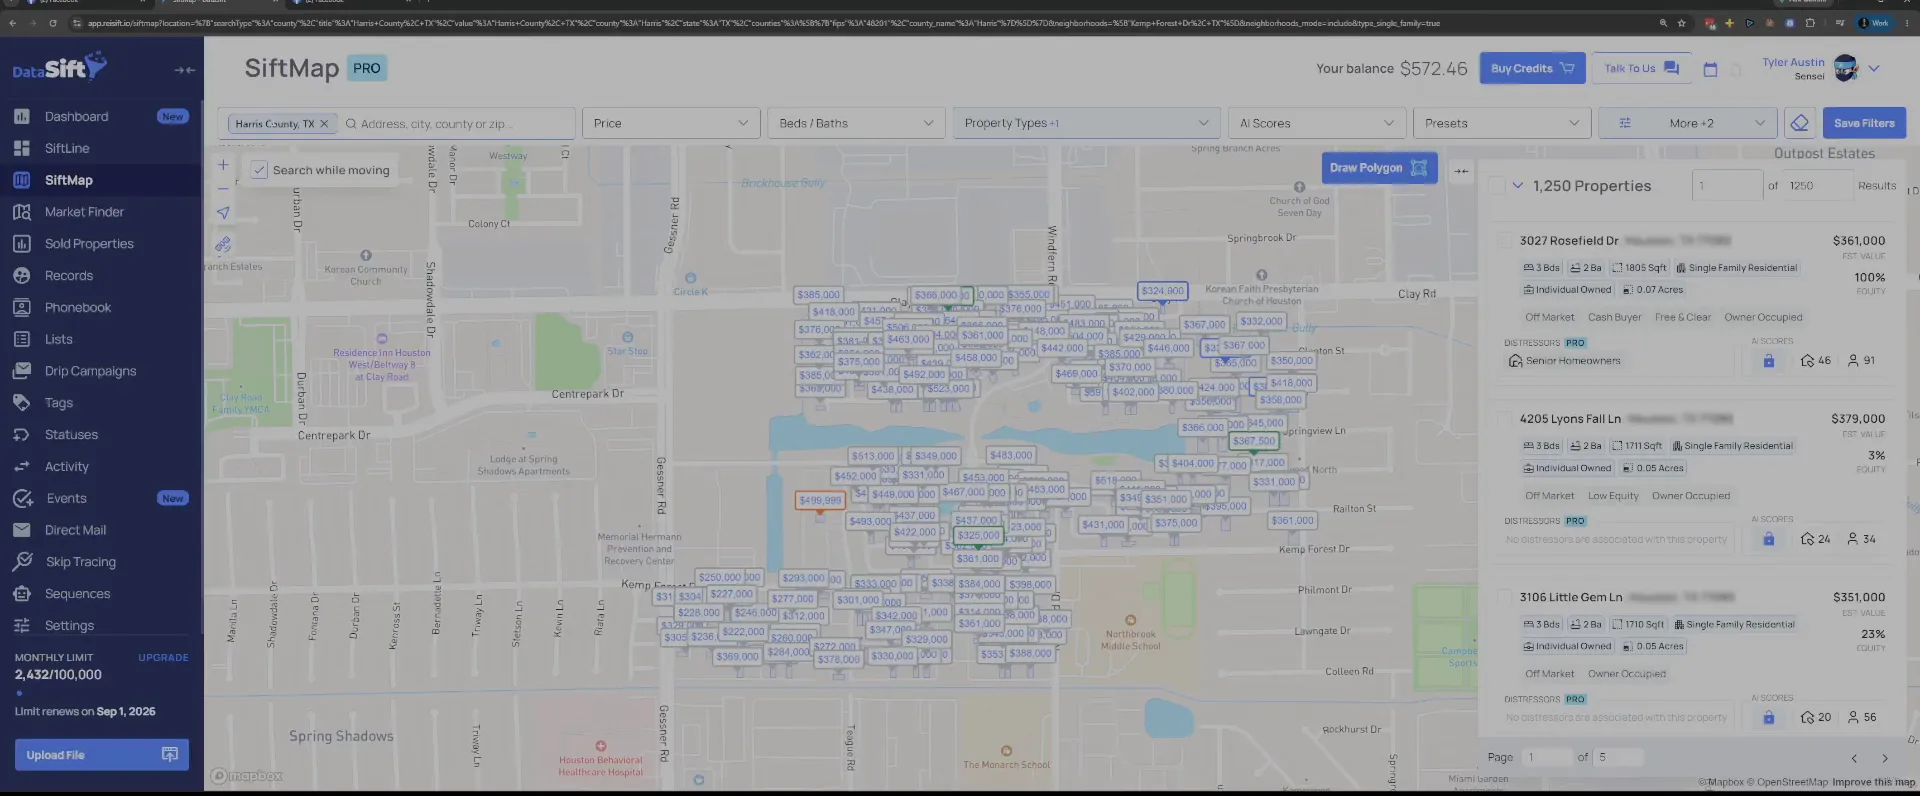
Open Owner details and check the Cash buyer dropdown.
Cash buyer is sitting on Any here, with Financial Details right underneath it. There's a couple different directions I can go from this panel.
One is switching cash buyers to yes, then going back to last sold date and back to say January. That gives me six months, eight months of coverage, and I can see how many cash transactions have happened in that area.
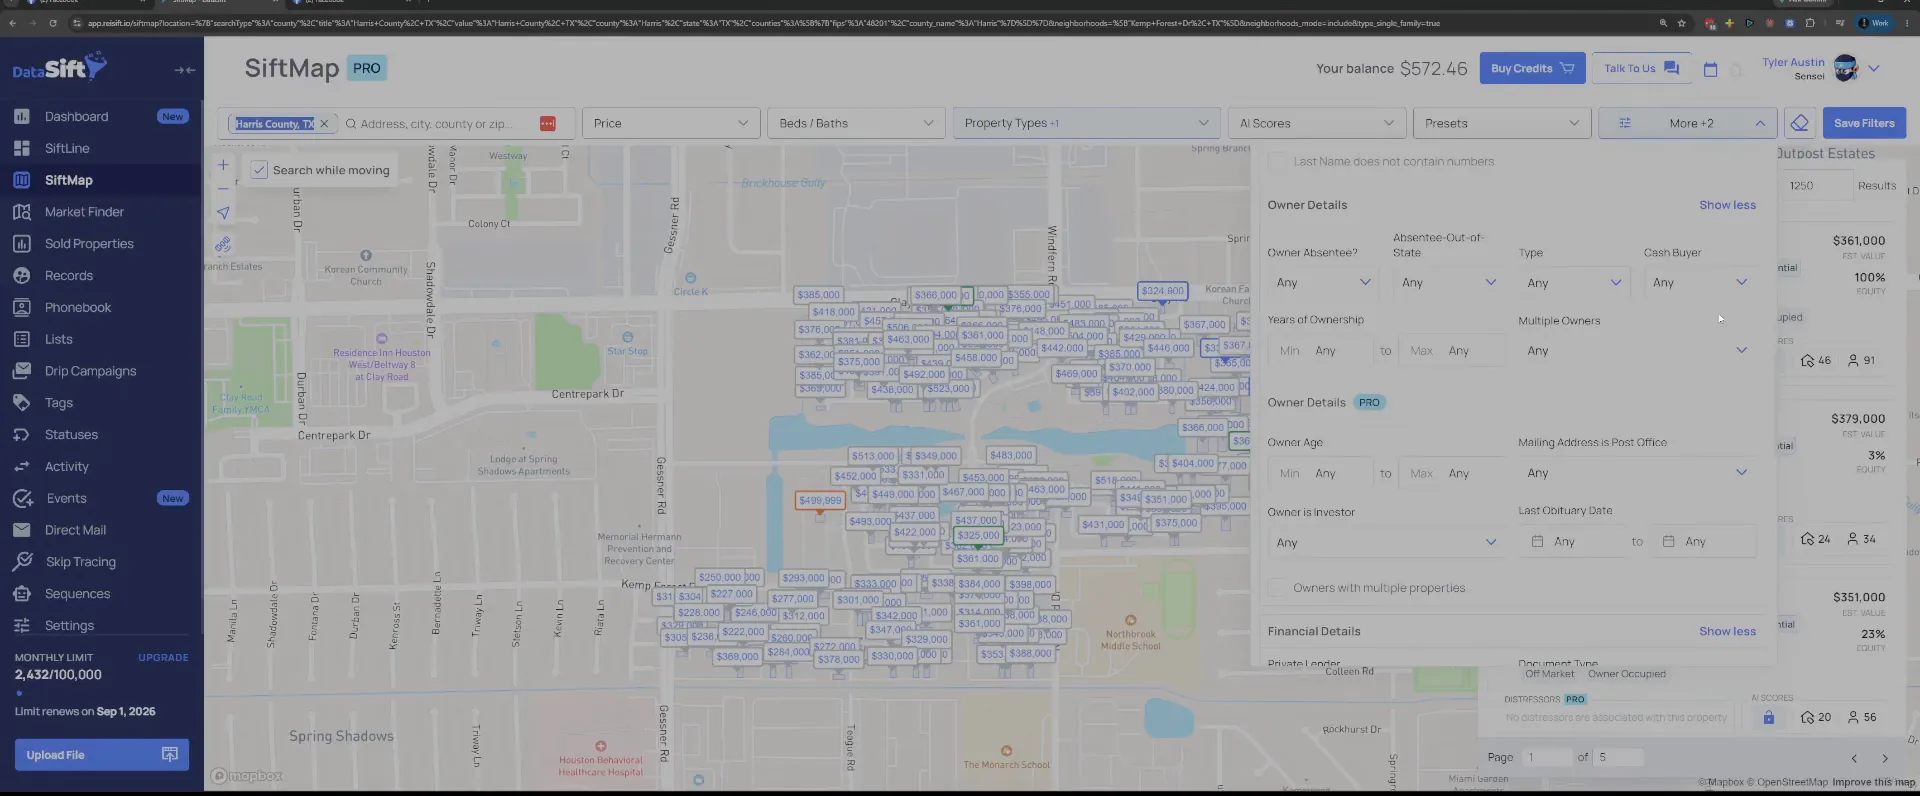
Set Cash buyer to yes and apply.
The results drop to a handful of properties in the Kemp Forest neighborhood. But I'm in Texas, and it's not really that great of a metric to go off of.
The other problem is, people can be investors buying holds, buying with financing. So I don't do that.
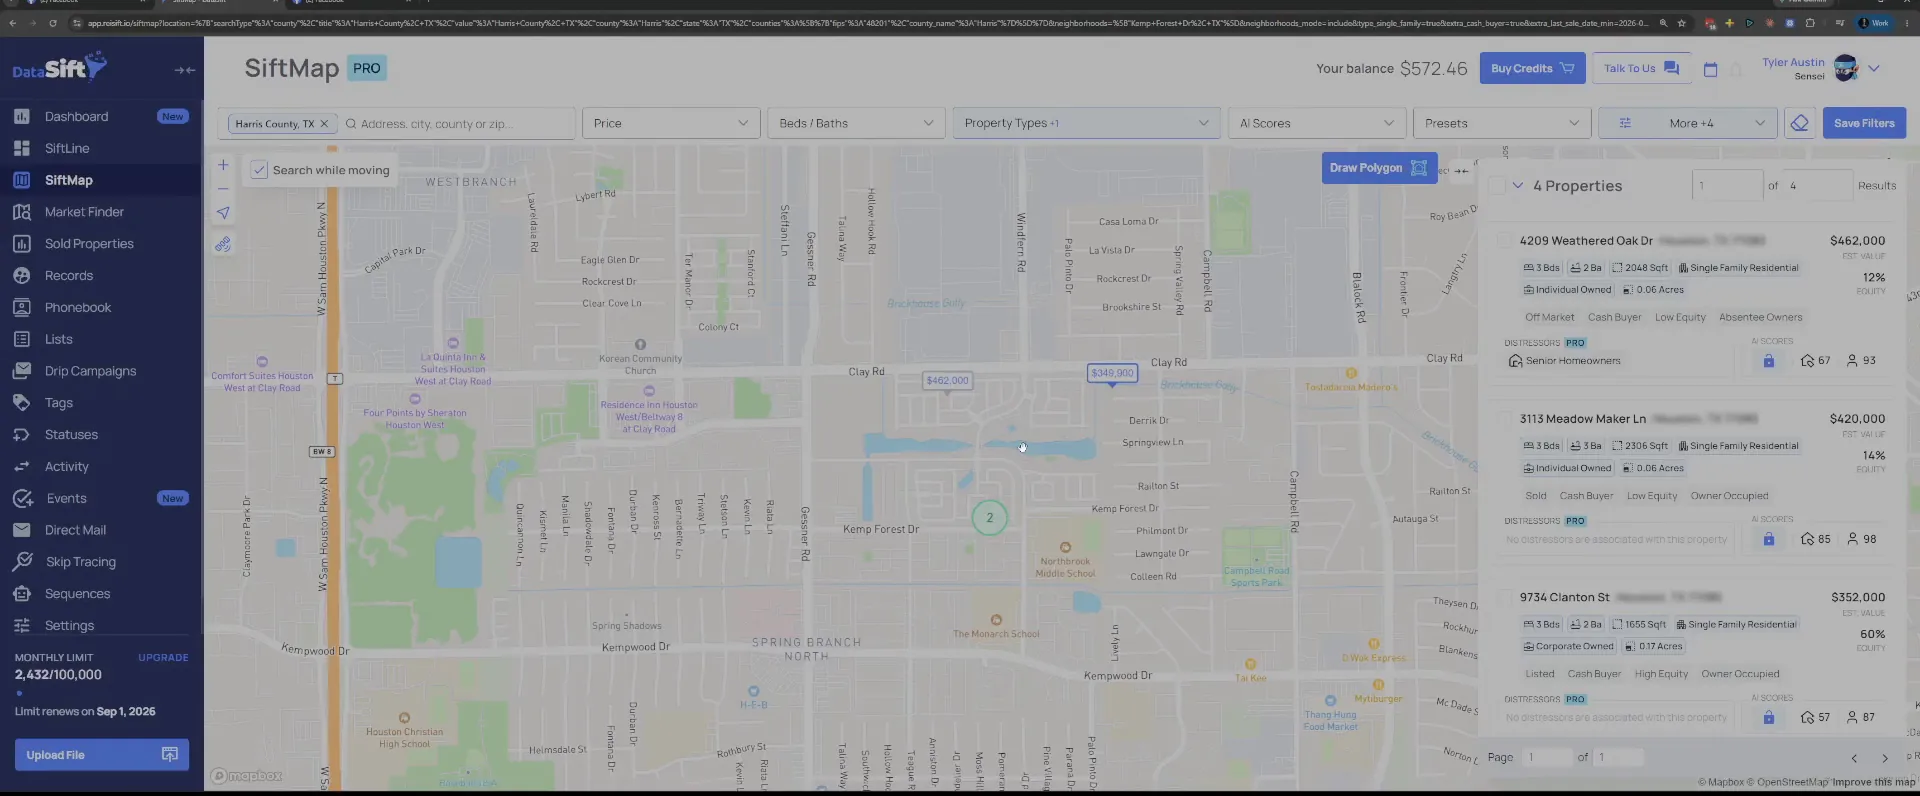
Leave Cash buyer where it is and go to last sold date.
Cash buyer is showing Yes in Owner Details, and I don't care whether it's cash buyer or not cash buyer. A lot of people just do that trap.
Instead, we're going to look at how many have sold in the neighborhood since January.
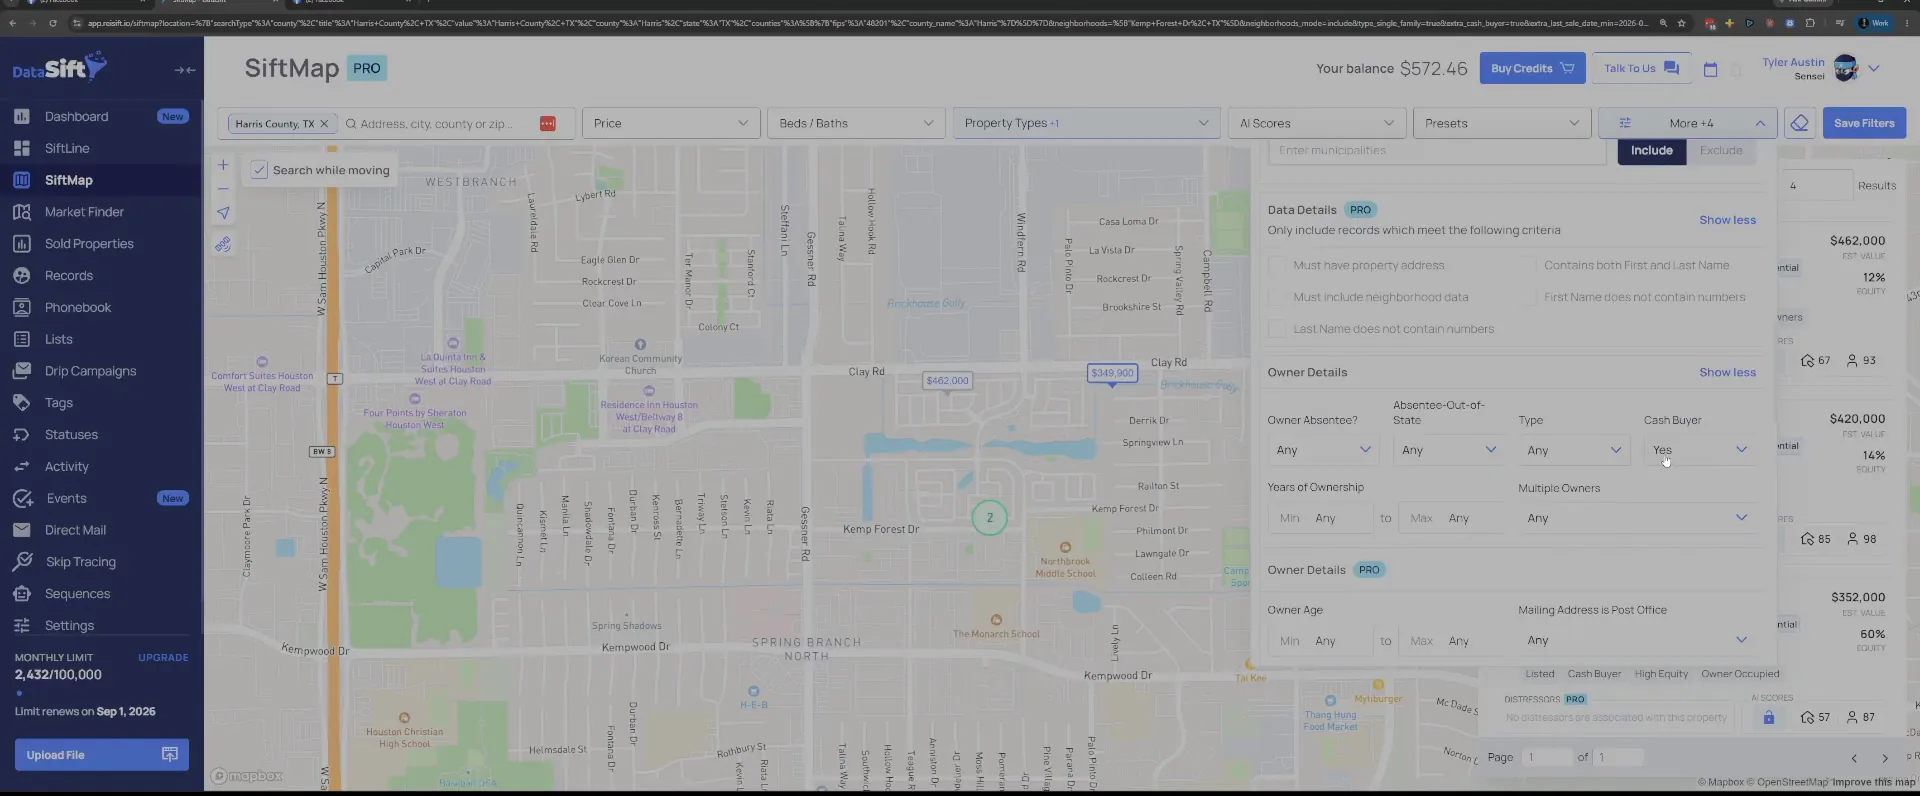
Set last sold date back to January and apply.
That shrinks the list quite a bit, but we do see that a couple are pending right now. Pending matters, because those are live transactions in the neighborhood.
And what we want to know now is how many of these are a property that sold because a flipper just finished flipping it.
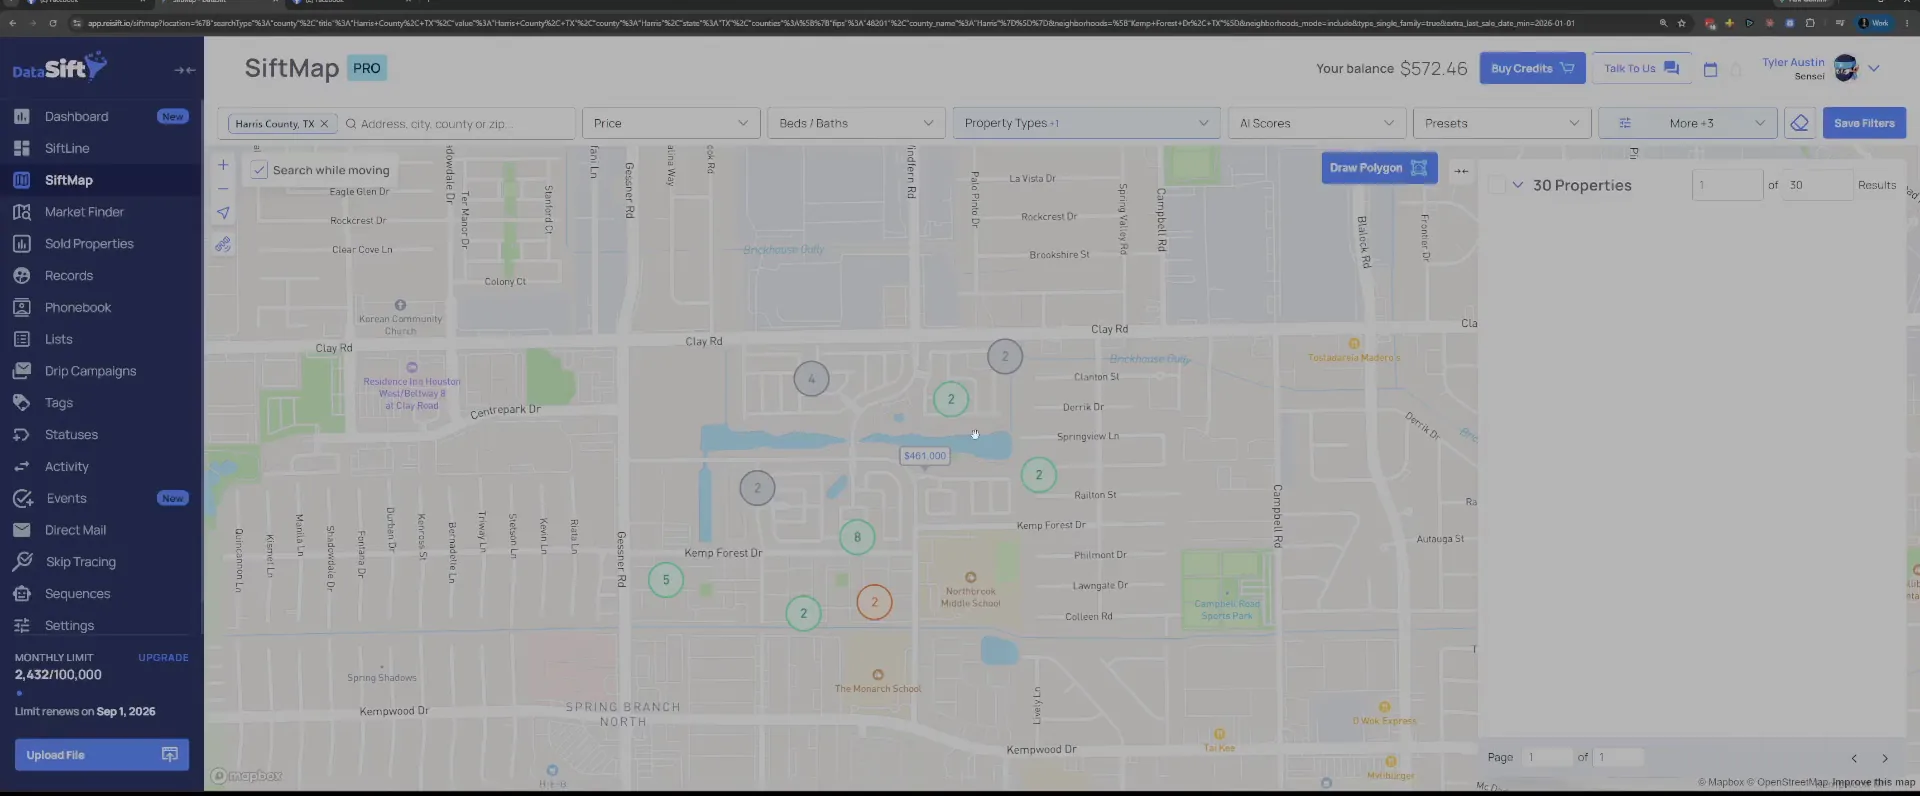
Scroll past the Neighborhoods field toward financial and transaction details.
The filters panel still has Kemp Forest Dr, TX in the neighborhoods field, and the investor transaction type is further down. So we're going to scroll down to our financial and transaction details.
There I use investor transaction type and choose flip. What that's telling me is the property was bought and sold in the last eighteen months, and it sold on the back end since January.
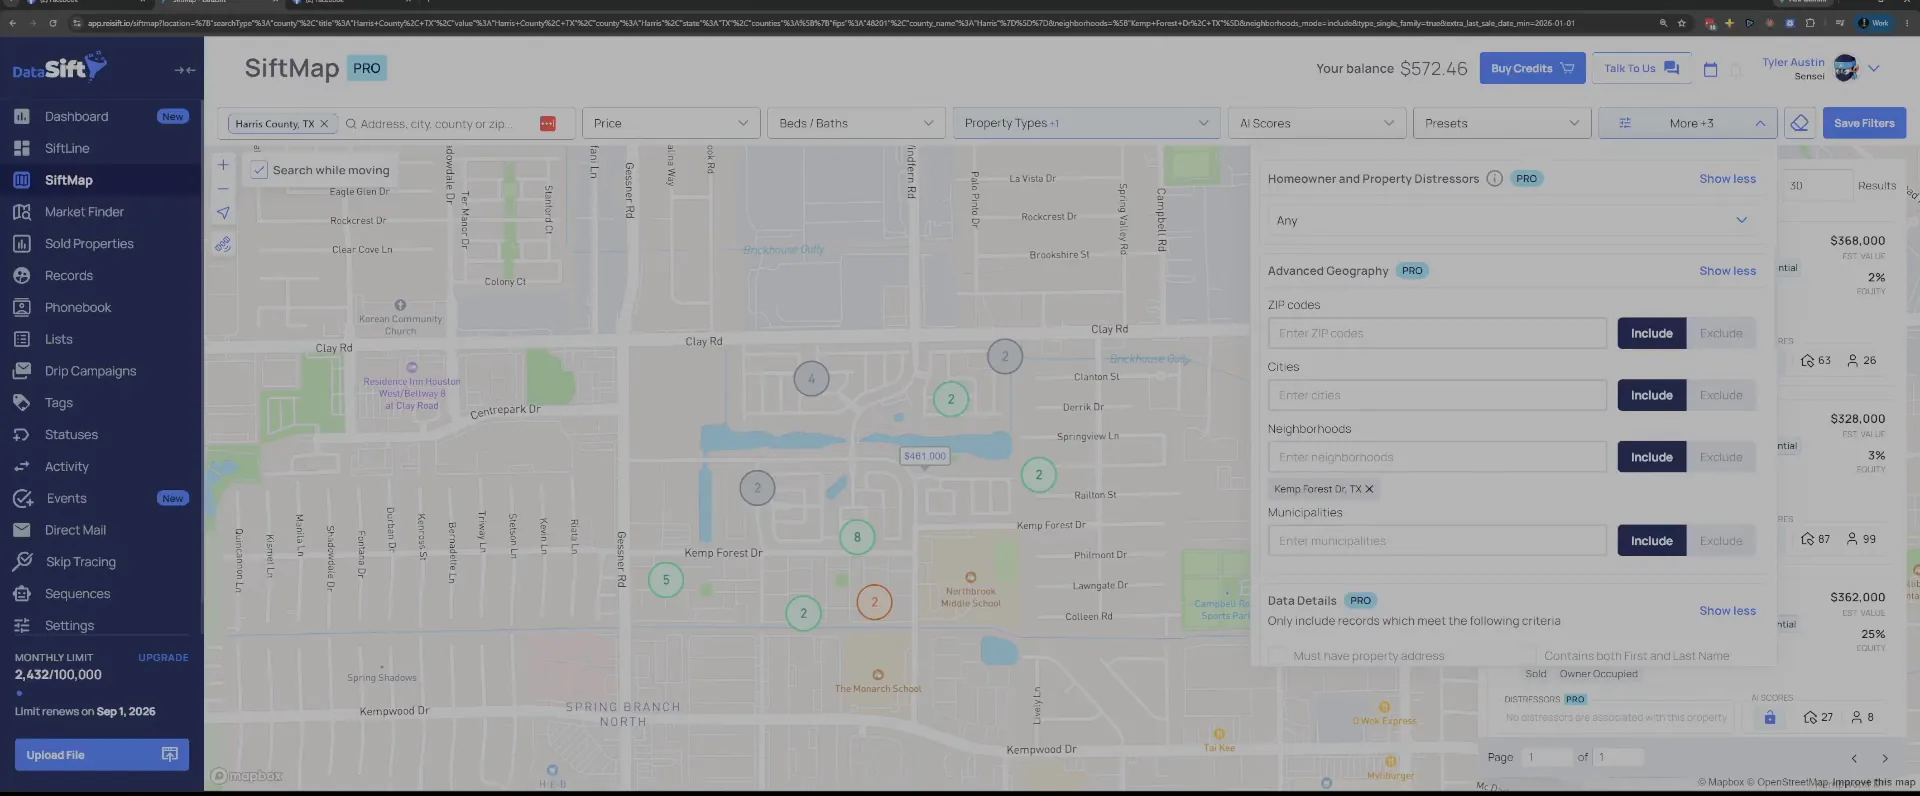
Choose flip under investor transaction type and apply.
We only have one of those in the whole neighborhood. So this neighborhood is not looking too great on the flip side, but we'll see.
They could have purchased that property in like July 2025 and sold it sometime since January to now.
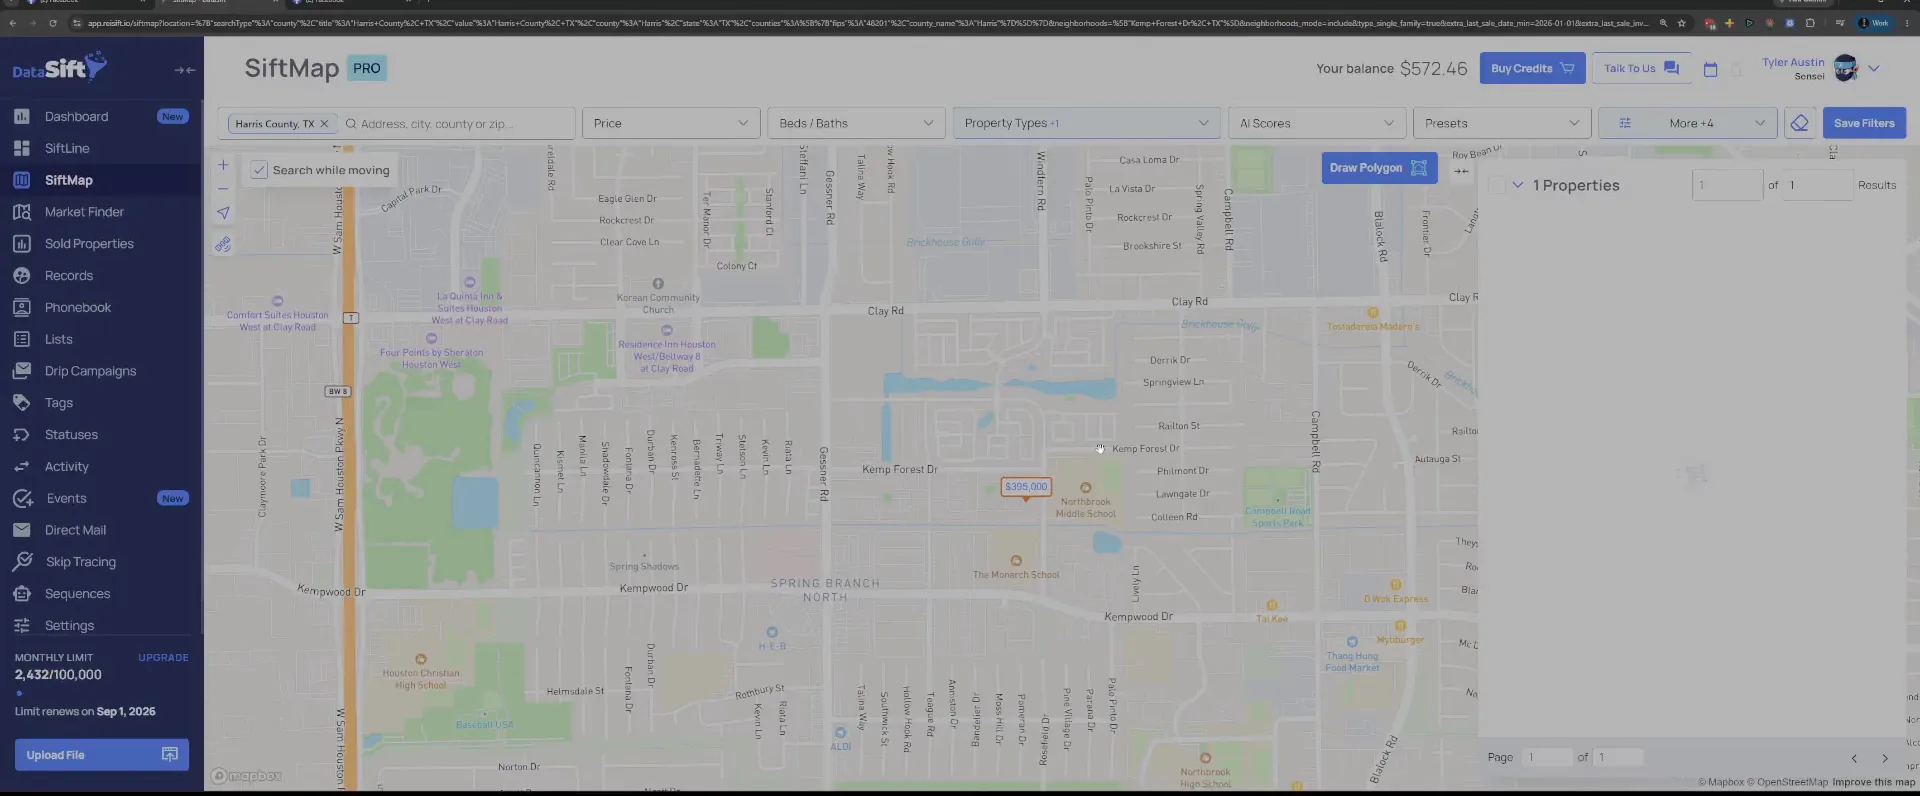
Read the pending flip result on the property card.
One property is left on the list with its status showing. The question is, was this a flipper or not.
That's what the record itself will tell me.
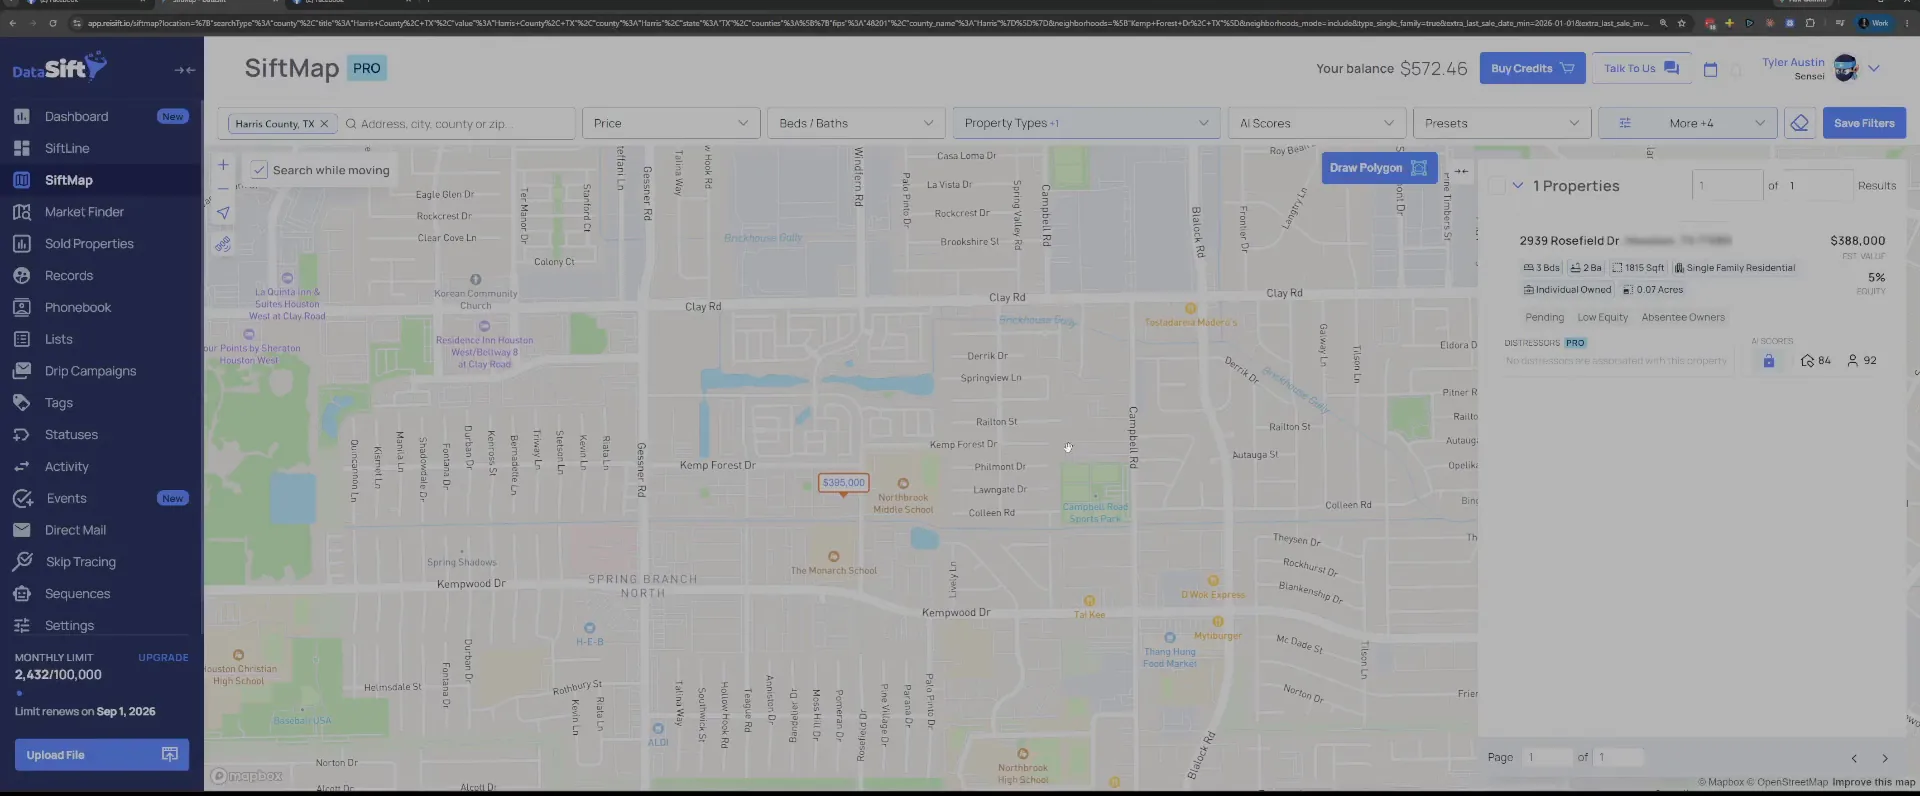
Open the record and find the History tab.
The details panel shows the MLS status and the price, with the tabs across it including History. History is where the transactions sit.
So we're gonna open up our record and click on history.
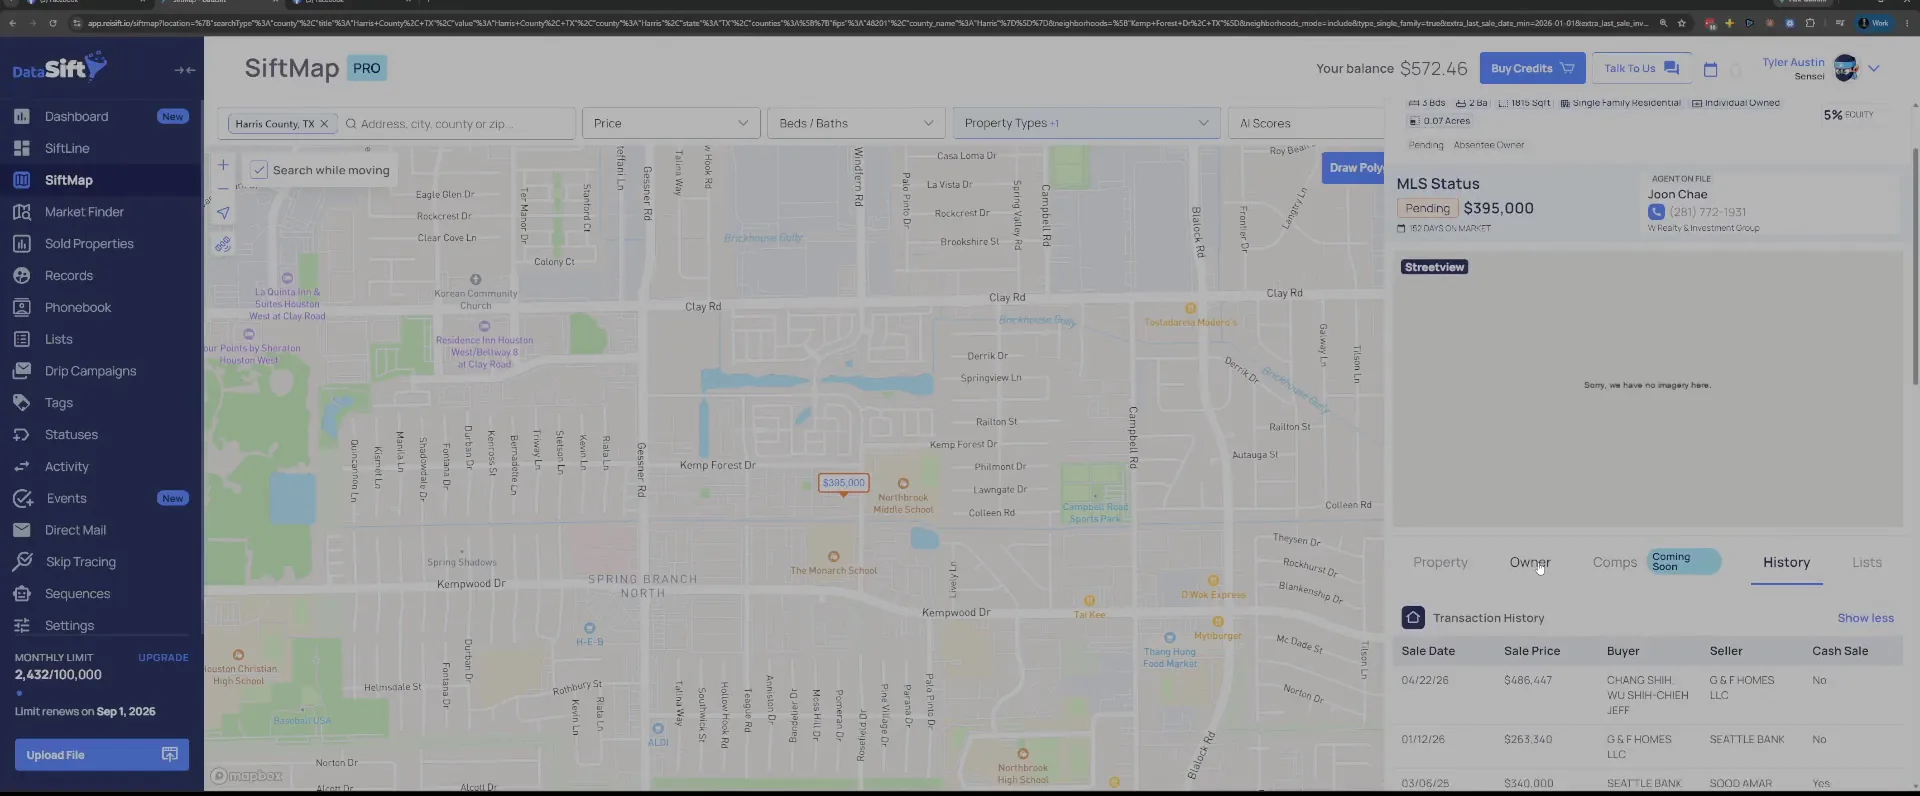
Click History and read the buyer and seller rows.
We see G and F homes bought the property. That's the entity name I'm after.
The table lays out the sale dates, the prices and who was on each side.
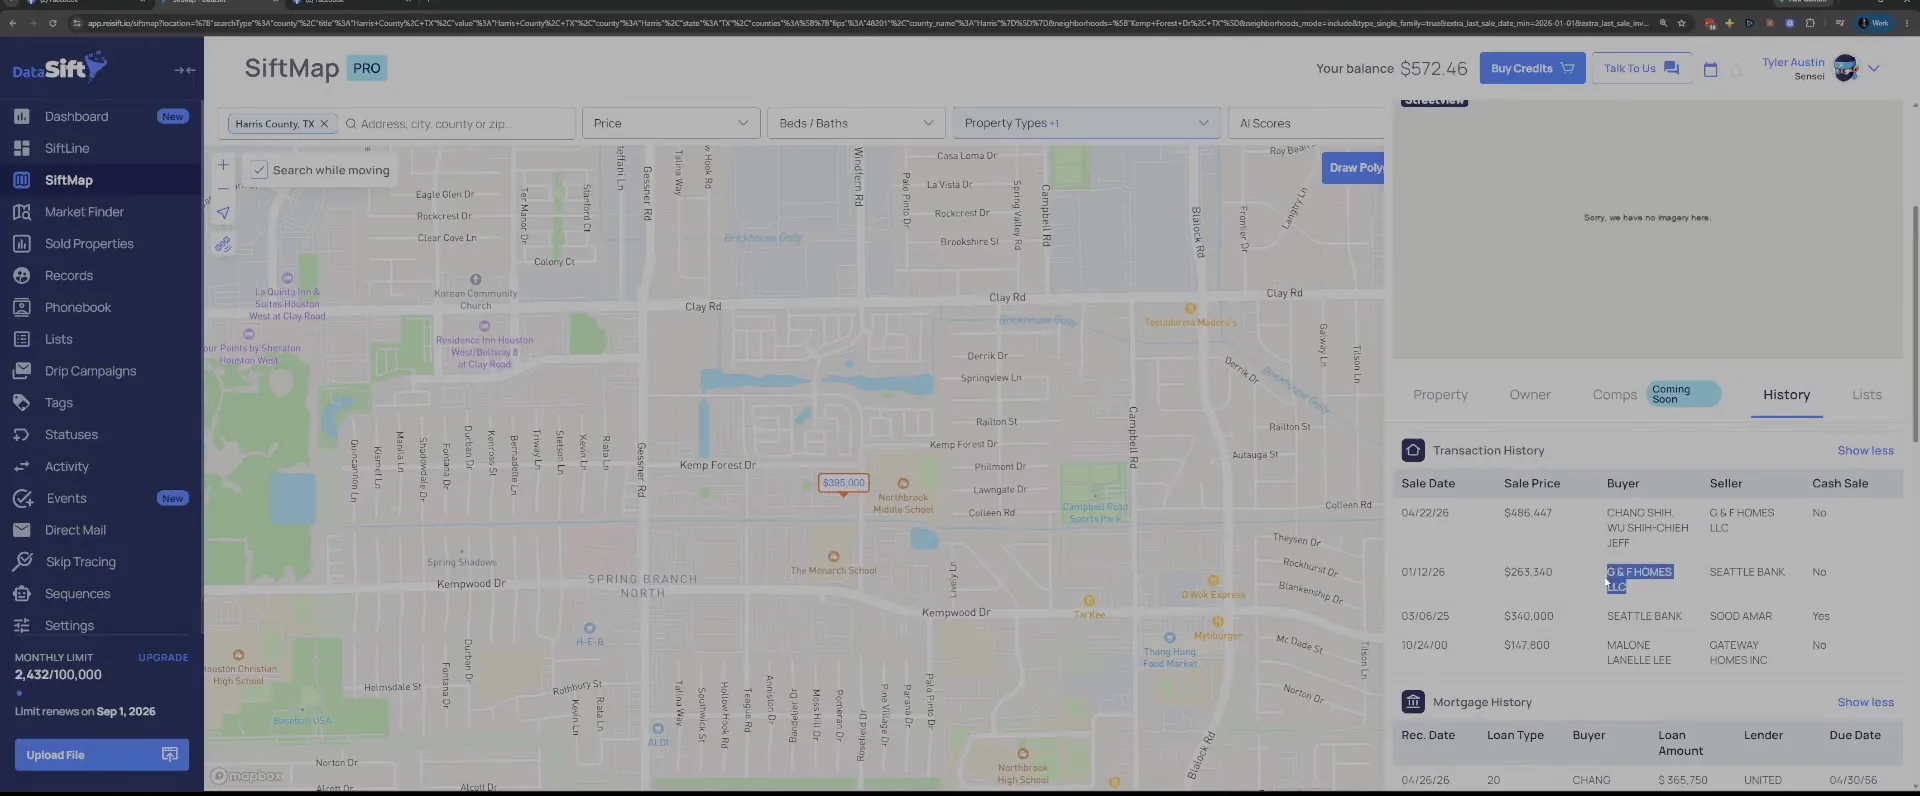
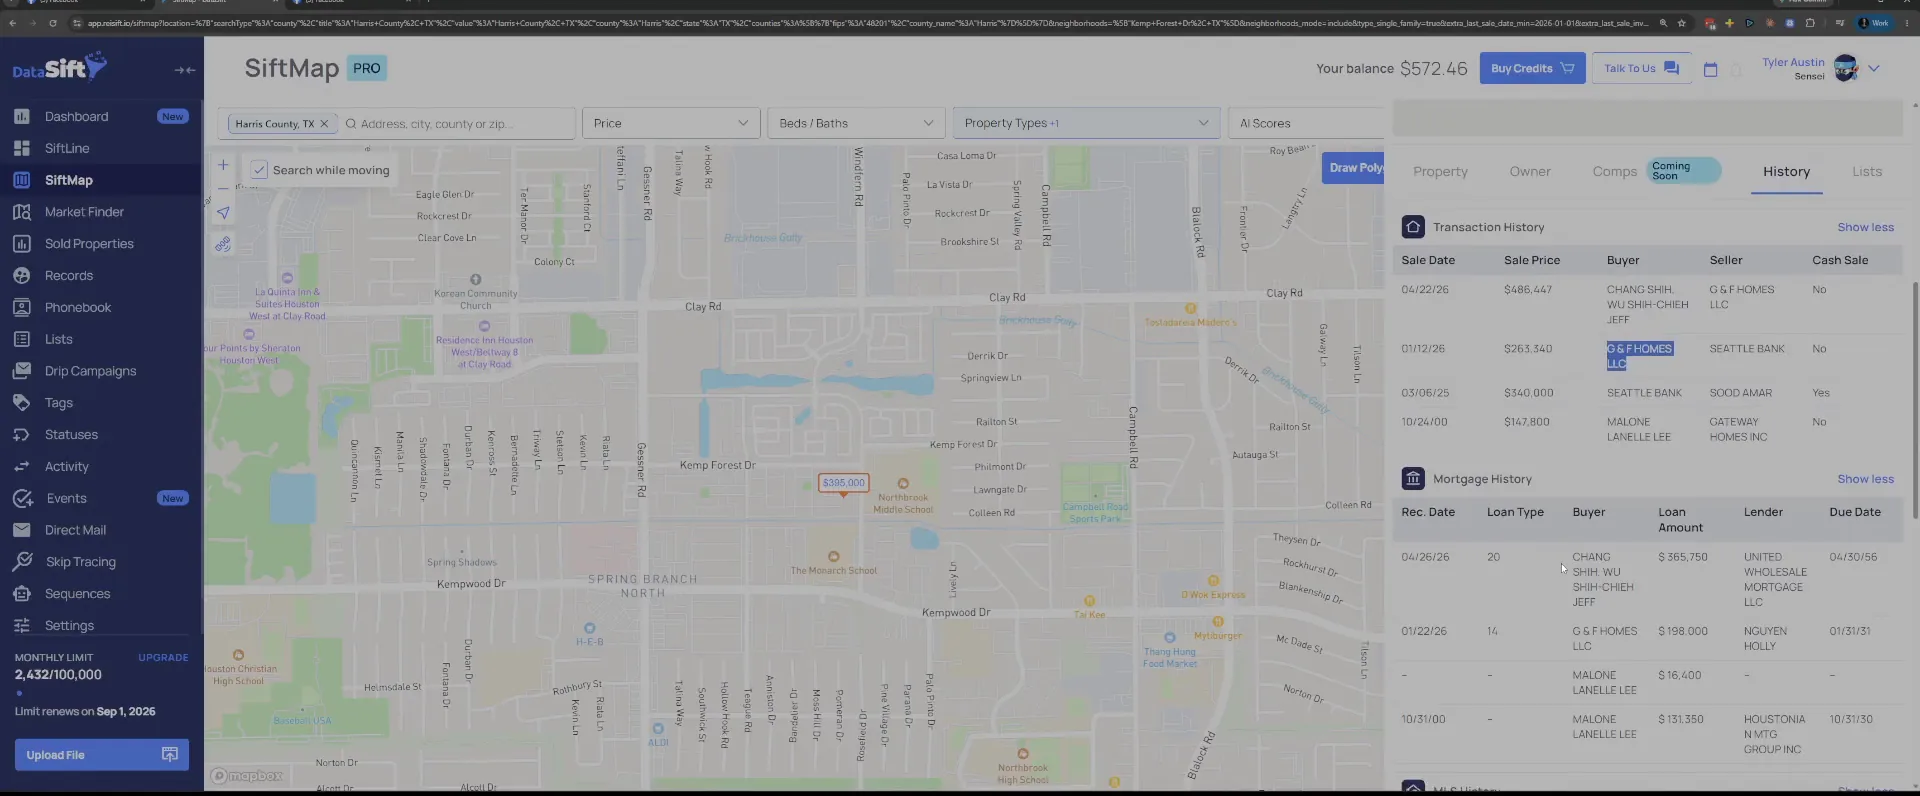
Scroll the History tab down to the mortgage rows.
They got a loan on it, and it's from a private money lender, Holly Nguyen. So the buyer is G and F Homes LLC and they borrowed private money to do it.
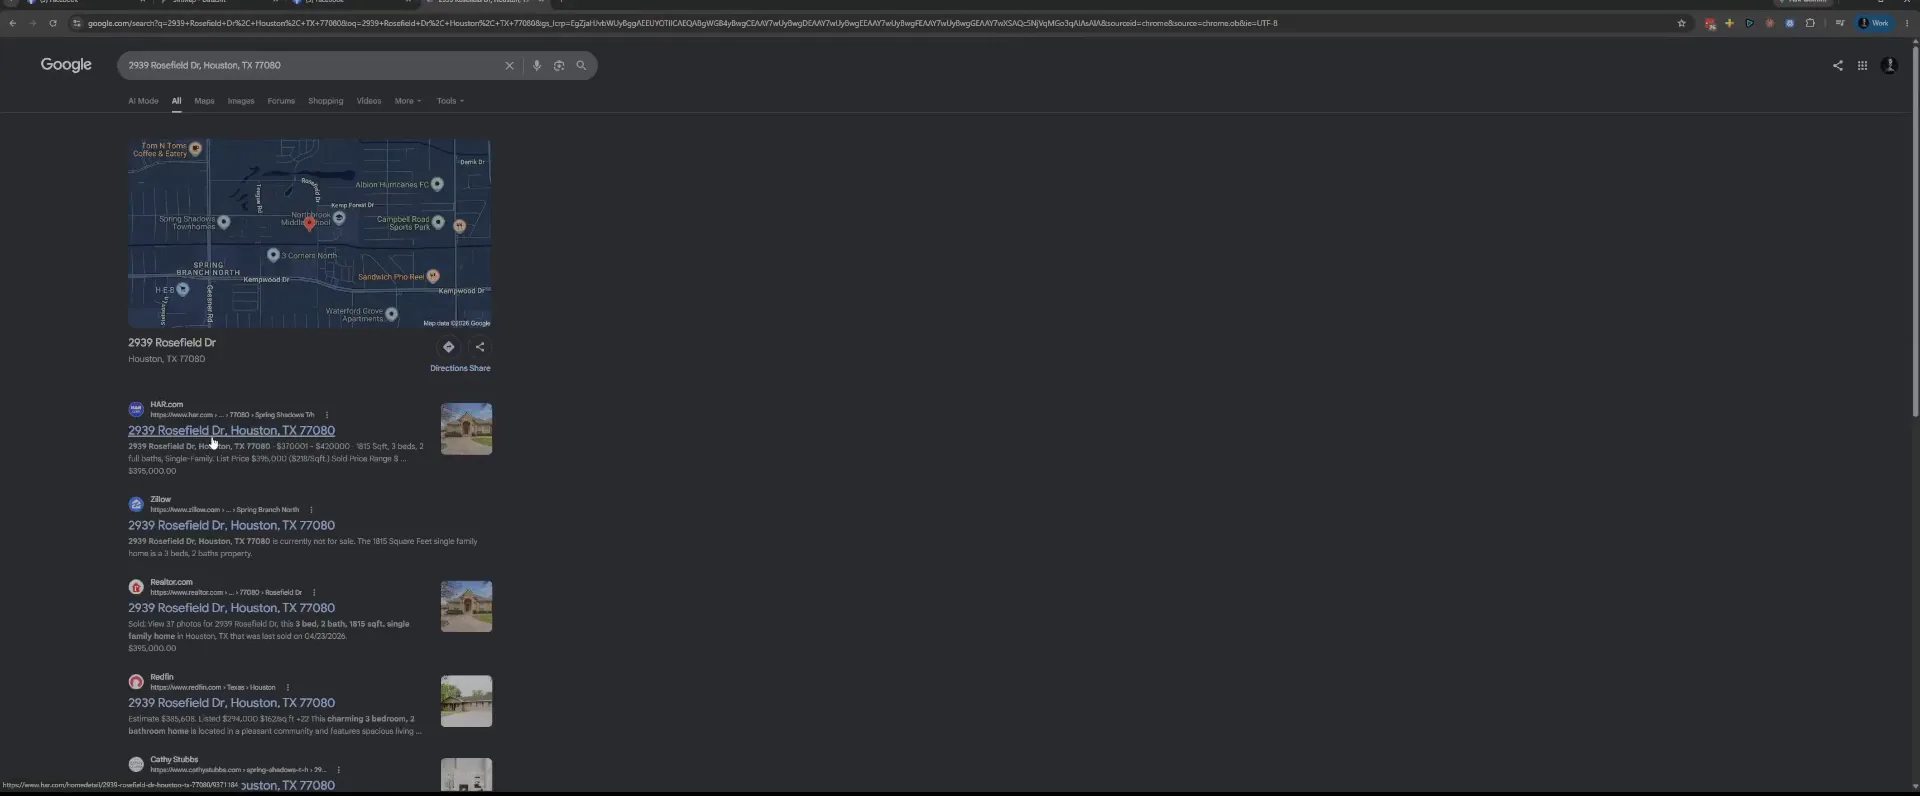
Oftentimes I'll just search that address to look and confirm, based on photos if they're available, was it flipped or not.
Search the property address in Google.
The results come back with the map and the listing links for that address. The listing is what carries the photos.
I'm only there to see the condition it sold in.
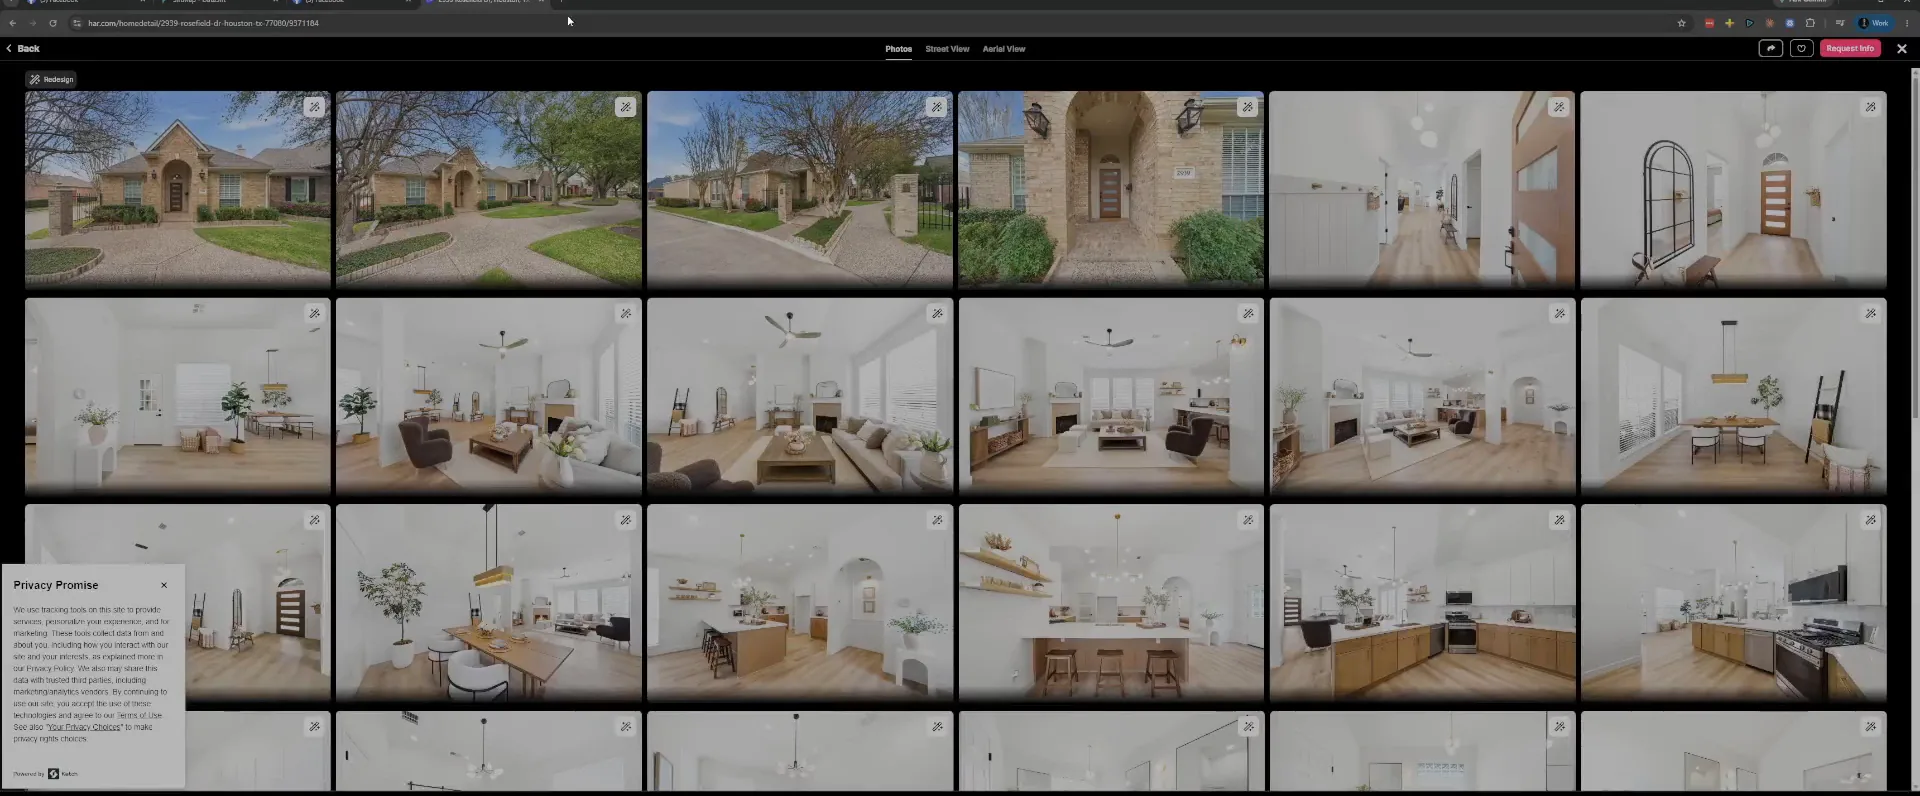
Open the listing photo gallery from the results.
The photos show a renovated interior and exterior. Clearly it was flipped.
So we know that that's a flipper. Next I click on the owner tab back in the record.
Go back to the History tab in the record.
The table is still there with the sale dates, prices, buyers and sellers. That's the trail of who owned it and when.
The owner tab tells me who holds it right now.
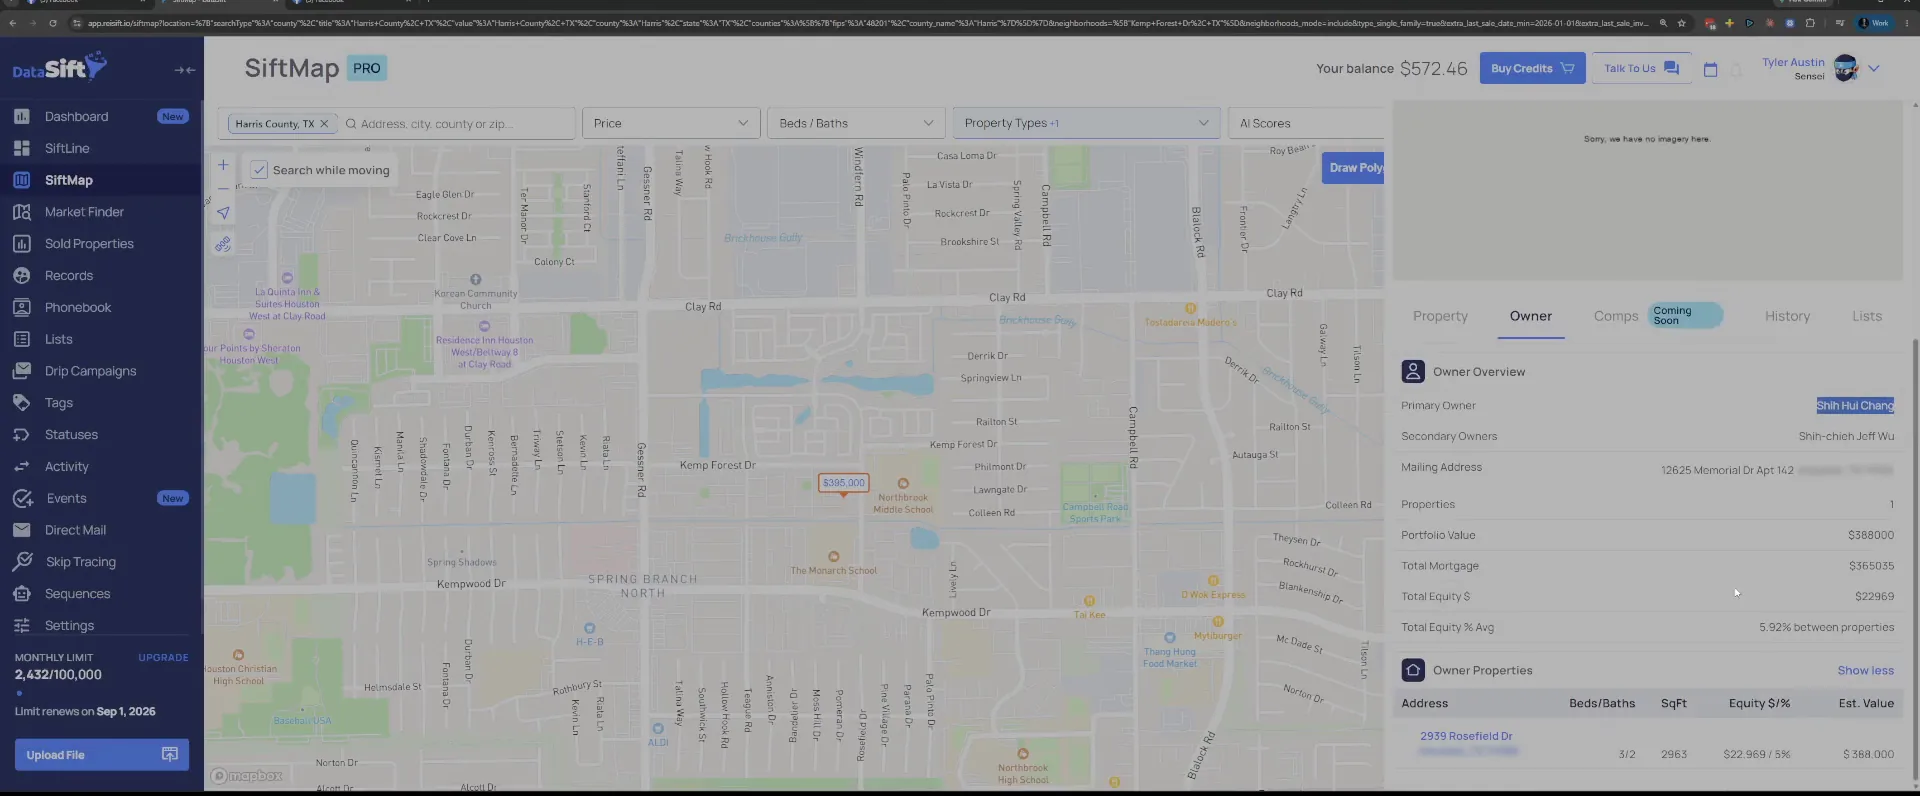
Click the Owner tab and read the owner overview.
The owner has already transferred to the person who bought the property. So the current owner here is the retail buyer, not the flipper.
And so therefore, that doesn't matter to me. The name I keep is the one off the history.
BEFORE YOU MOVE ON