
PART 1
Set up your county.
Doors per deal is how many properties you reach to find one deal. Every list in your county gets that number. The order follows from it.
What the framework is.
Reverse engineer the marketing from the data.
The framework tells you how many properties you have to reach on every type of list before you spend a dollar. You pick the list by its number, not by whether the name sounds motivated.
It breaks down the amount of properties that you need to reach out to on every single type of list, and knowing exactly where your marketing is going before you ever spend a dollar.

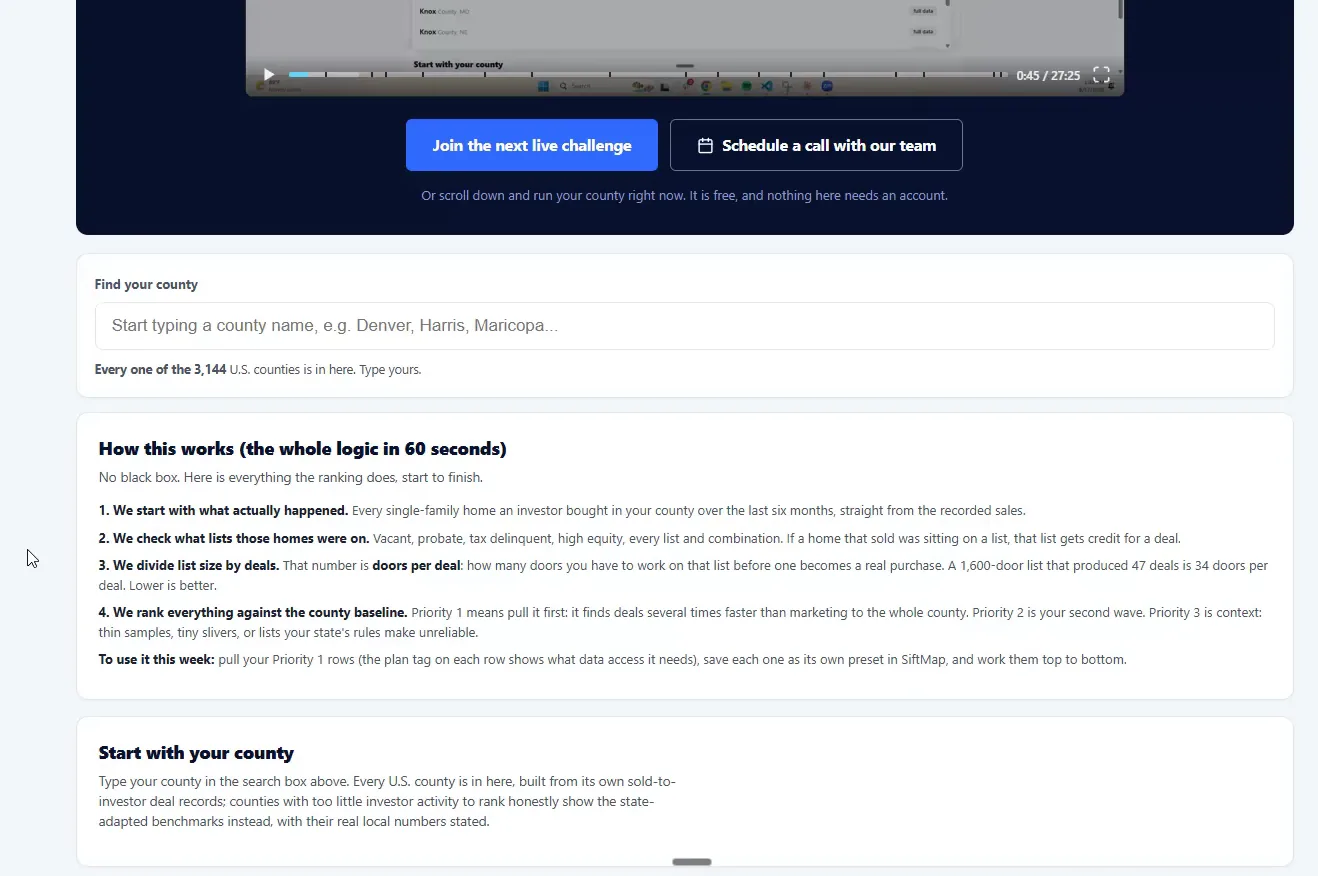
Start with your county.
Run one county at a time.
You can put in several counties at once. Do not. Build the whole plan for one, then repeat it. Independent cities work the same way.
Work the six sections top to bottom.
Every county page carries the same six. At a glance, the market ladder, obituary data, first to market, top ZIP codes, price range.
Obituary data sits in its own category because it runs its own process. I started pulling it at the beginning of 2026.
At a glance.
Read the baseline before you read any list.
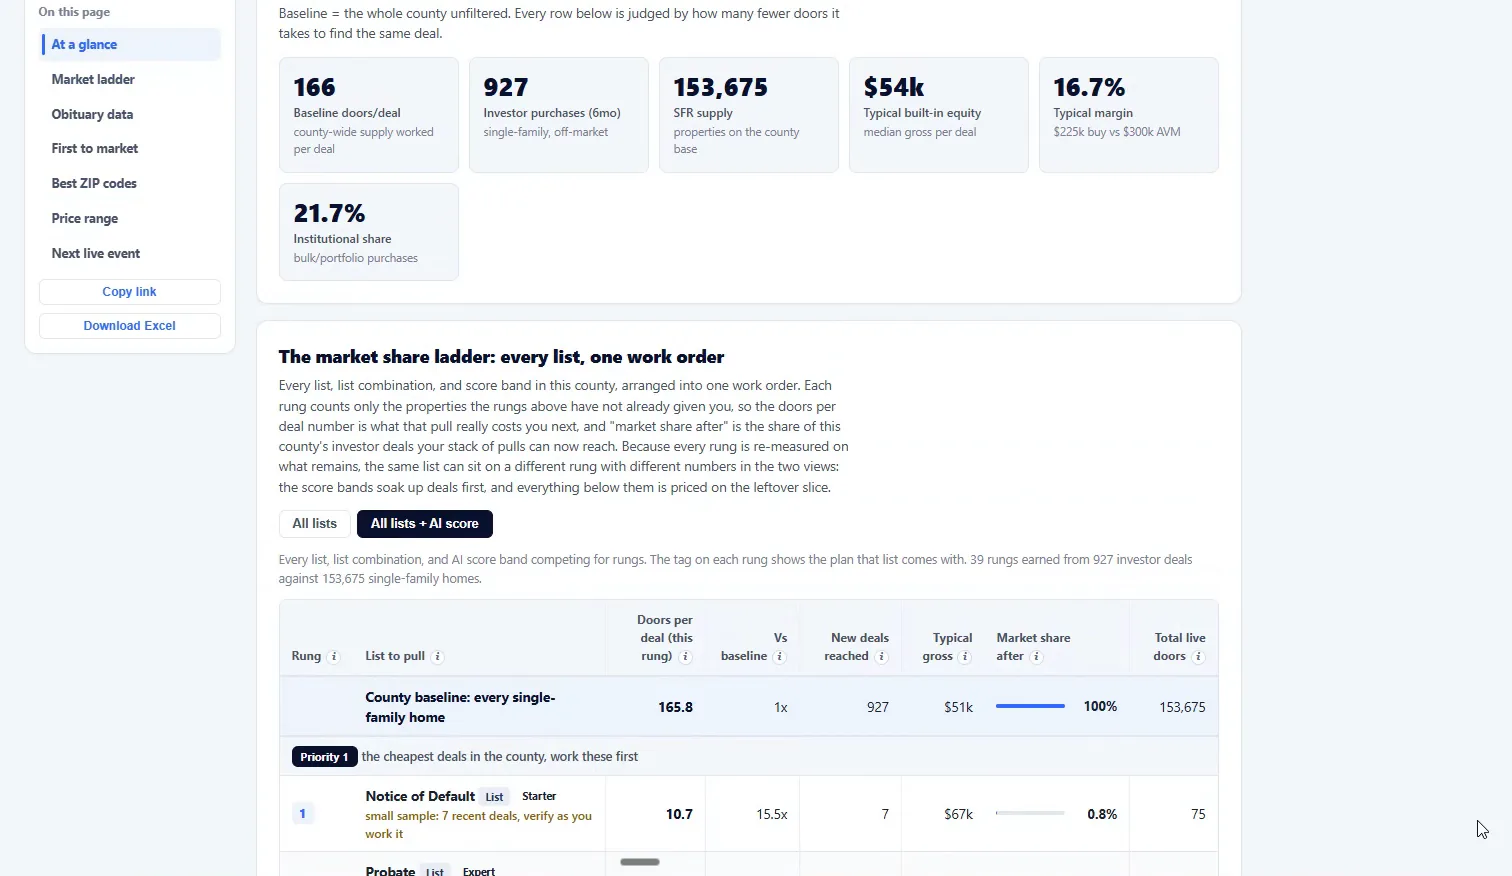
The first number that matters is investor transactions. Knox County had 927 in the last six months, against 153,675 single family homes.
Market blind to all of them and you reach one investor transaction every 166 properties. That is the bar. Every list below is judged on how much better it does than 166.
The market ladder.
Read the ladder as a work order.
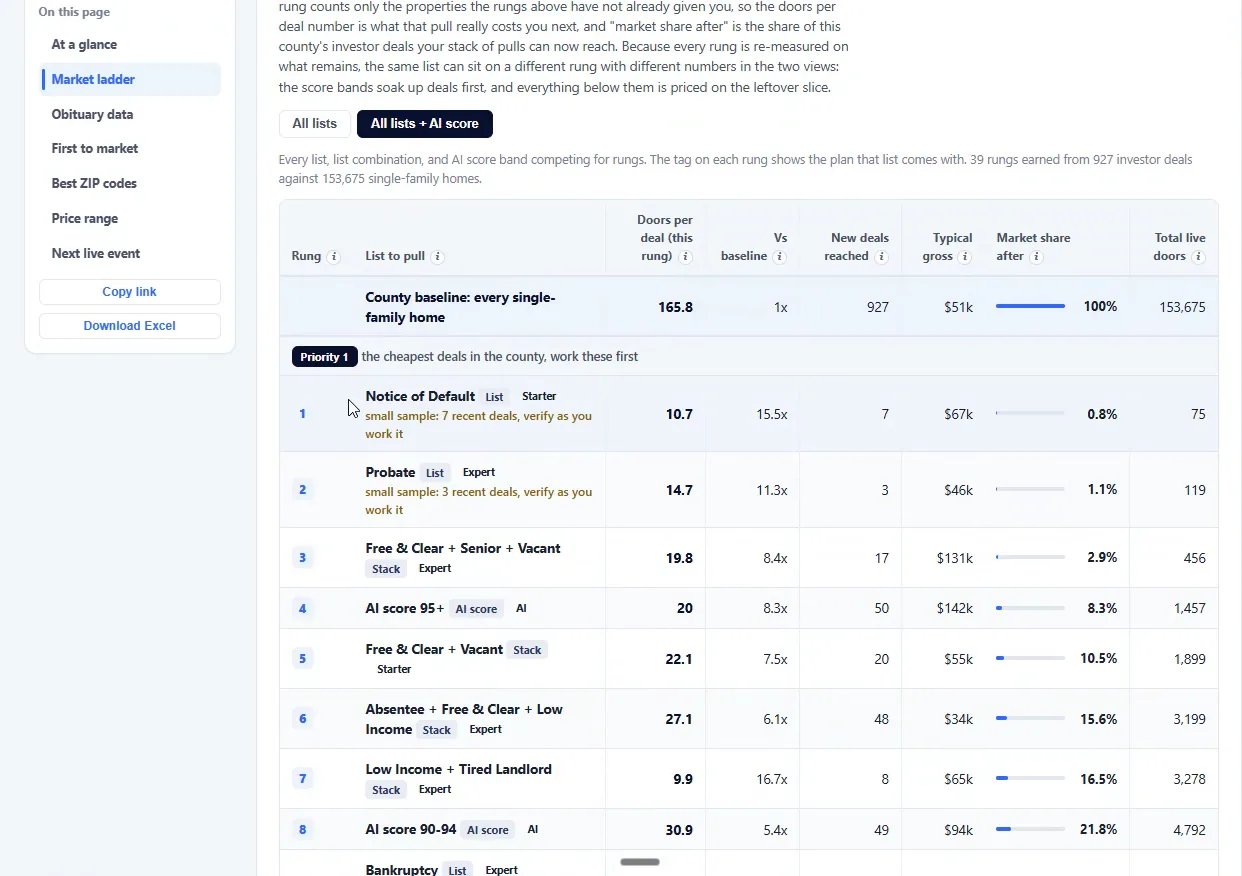
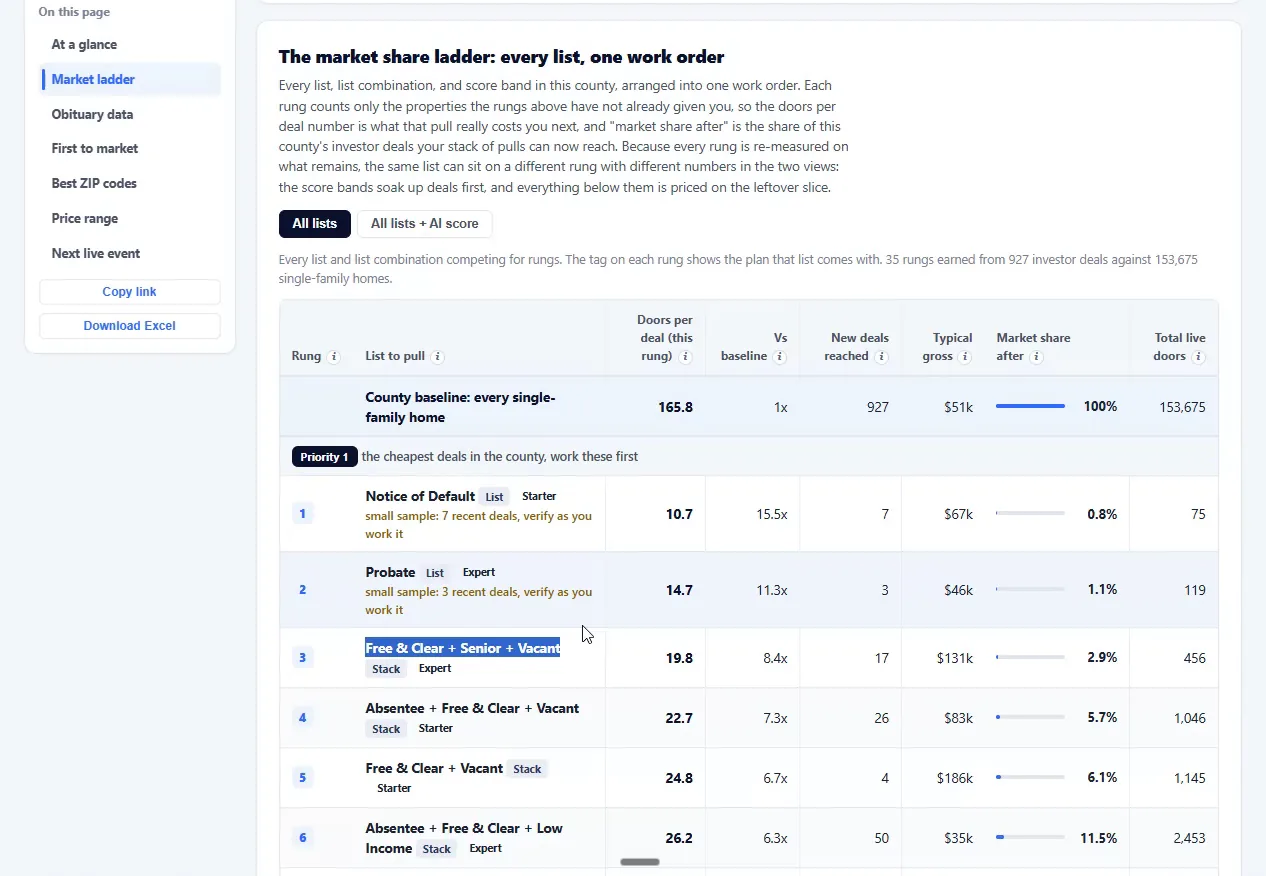
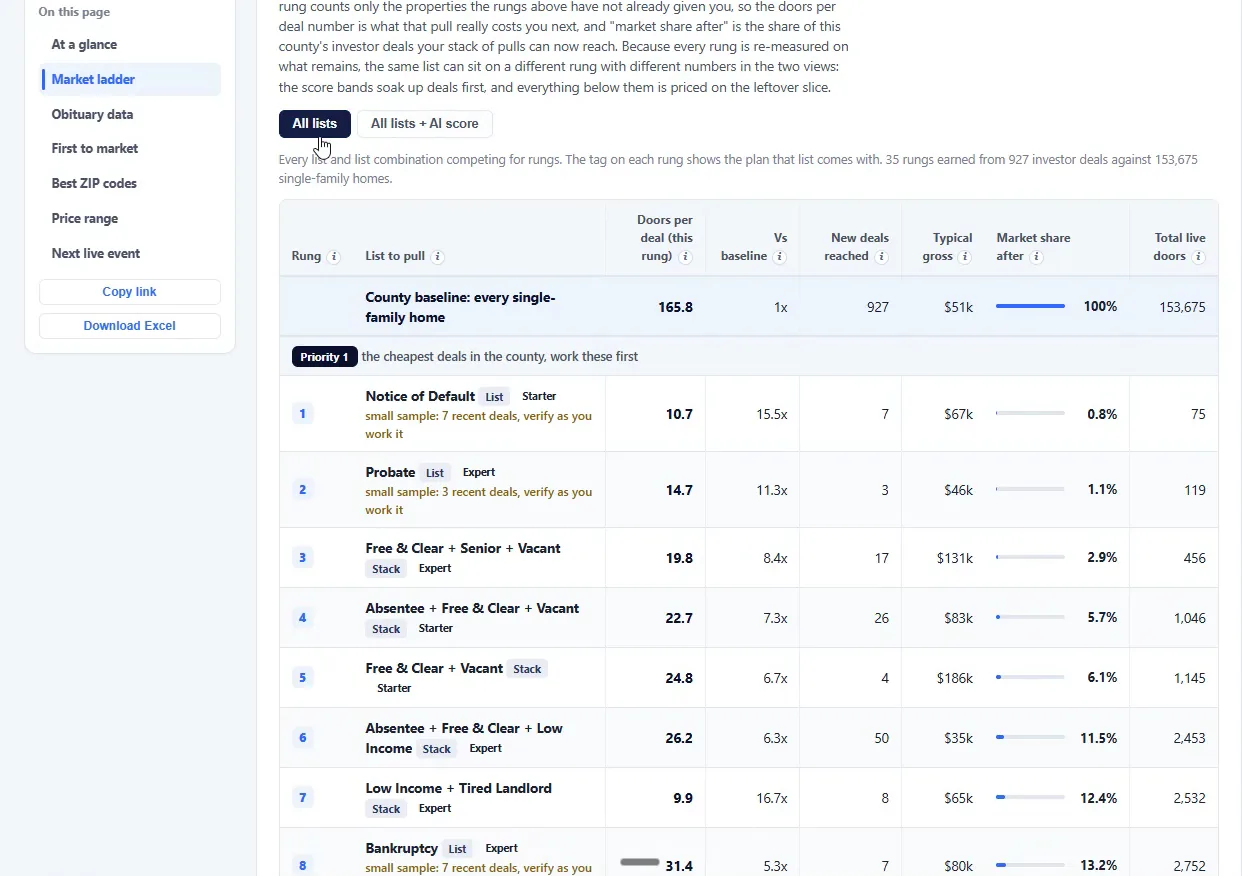
It sorts by doors per deal, most efficient first, and assumes you pull in that exact order. Every rung counts only the properties the rungs above have not already given you.
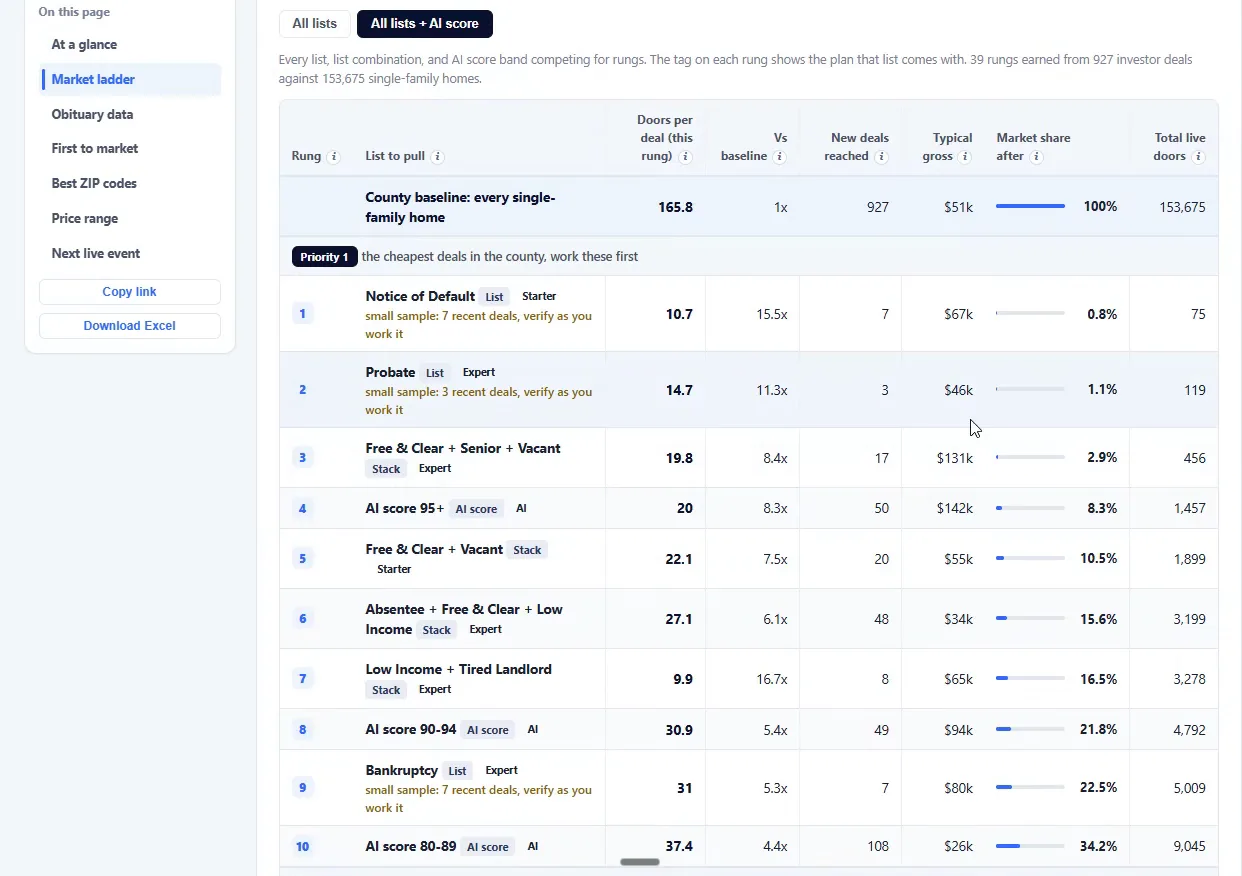
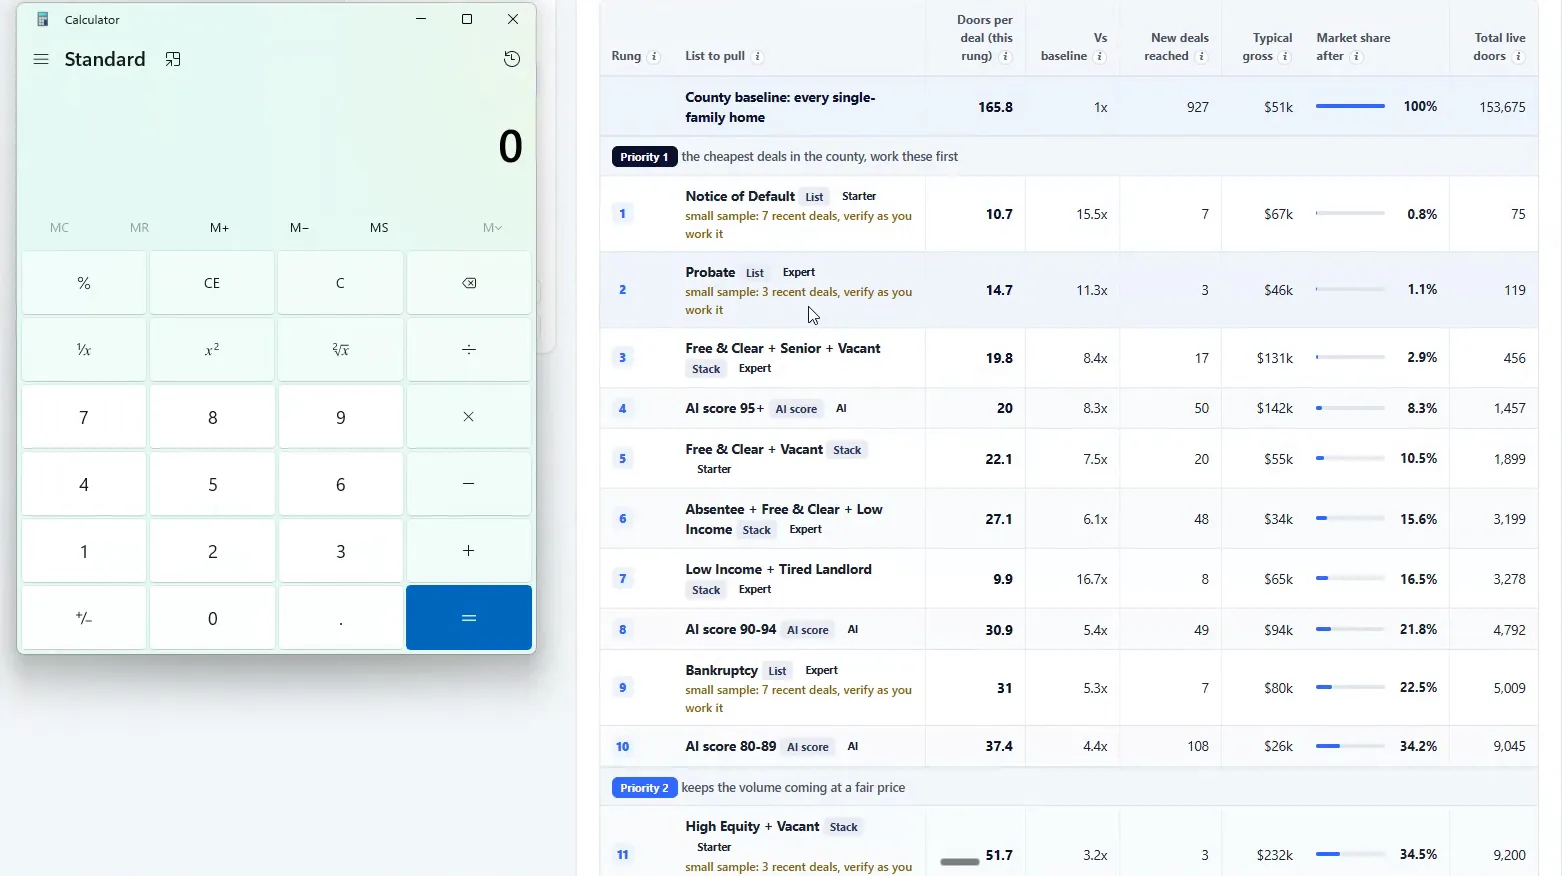
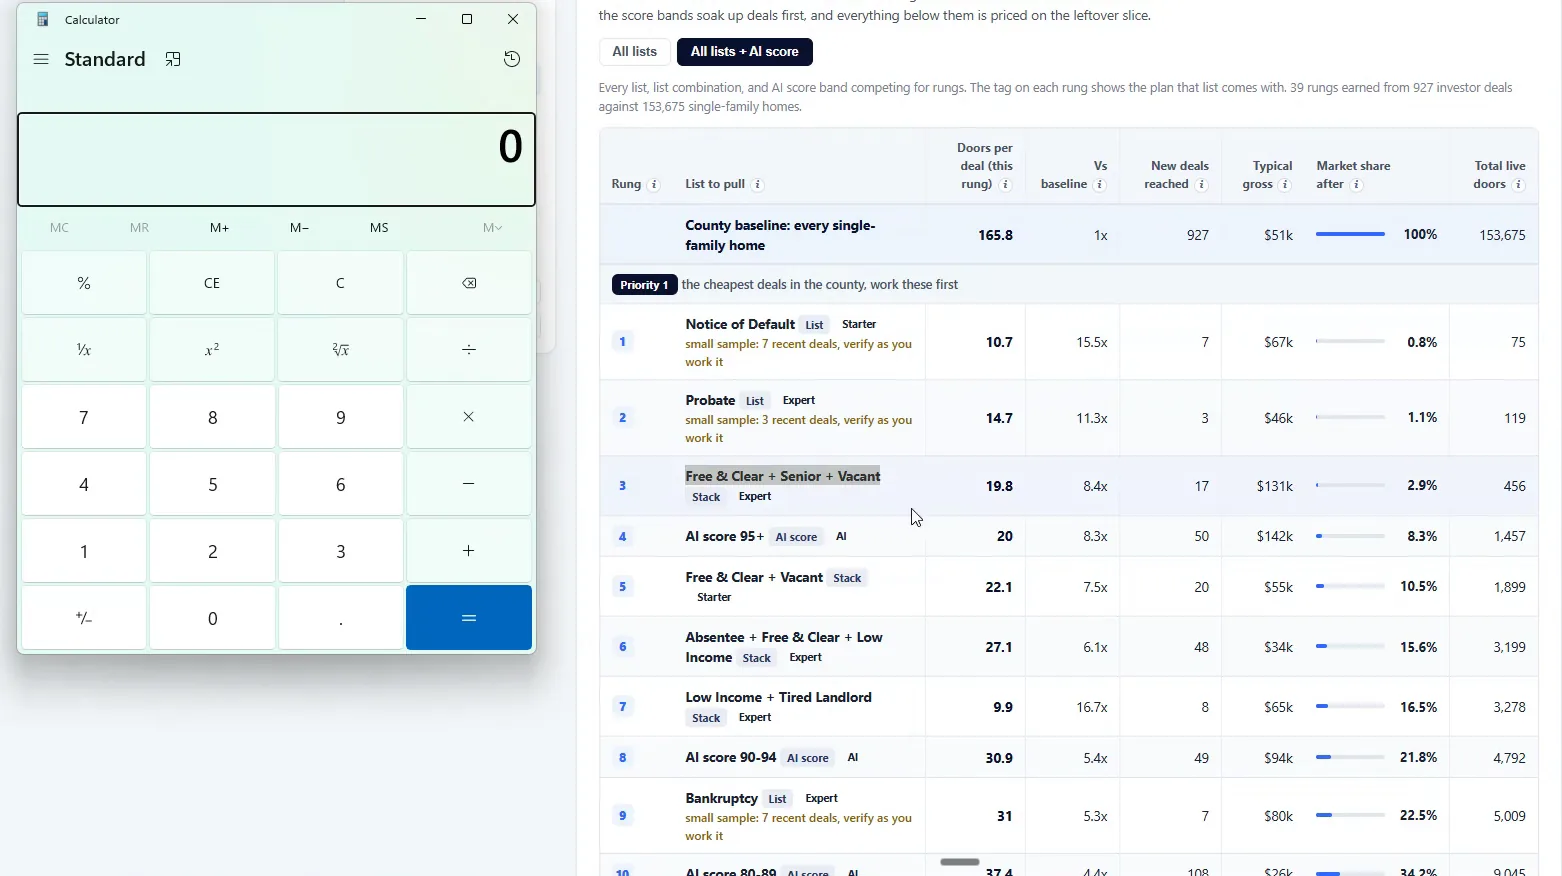
Knox County came out notice of default, then probate, then free and clear plus senior plus vacant together, then the AI score of 95 plus.
BEFORE YOU MOVE ON
PART 2
Where the lists come from.
Every data tool resells the same upstream feeds. How long that takes decides which lists you pull today and which you go get yourself.
What the AI score does.
Treat the score as a rung, not a separate product.
It competes on the same doors per deal number as every other list. In Knox County the 95 plus band lands at rung four.
Where the lists start.
Know the supply chain your list came through.
SiftMap, Batch, PropStream, DealMachine and PropertyRadar all buy from the same raw companies. First American, CoreLogic and others. That data arrives as PDFs, raw files and databases, and it has to be transformed before you can market to it.
The transformation is not the same speed everywhere. Los Angeles County sends a file every night. A rural county runs up to 90 days behind. Pull from the courthouse and you skip the middle layer entirely.
Pull now or build a process.
Split the ladder into pull now and build.
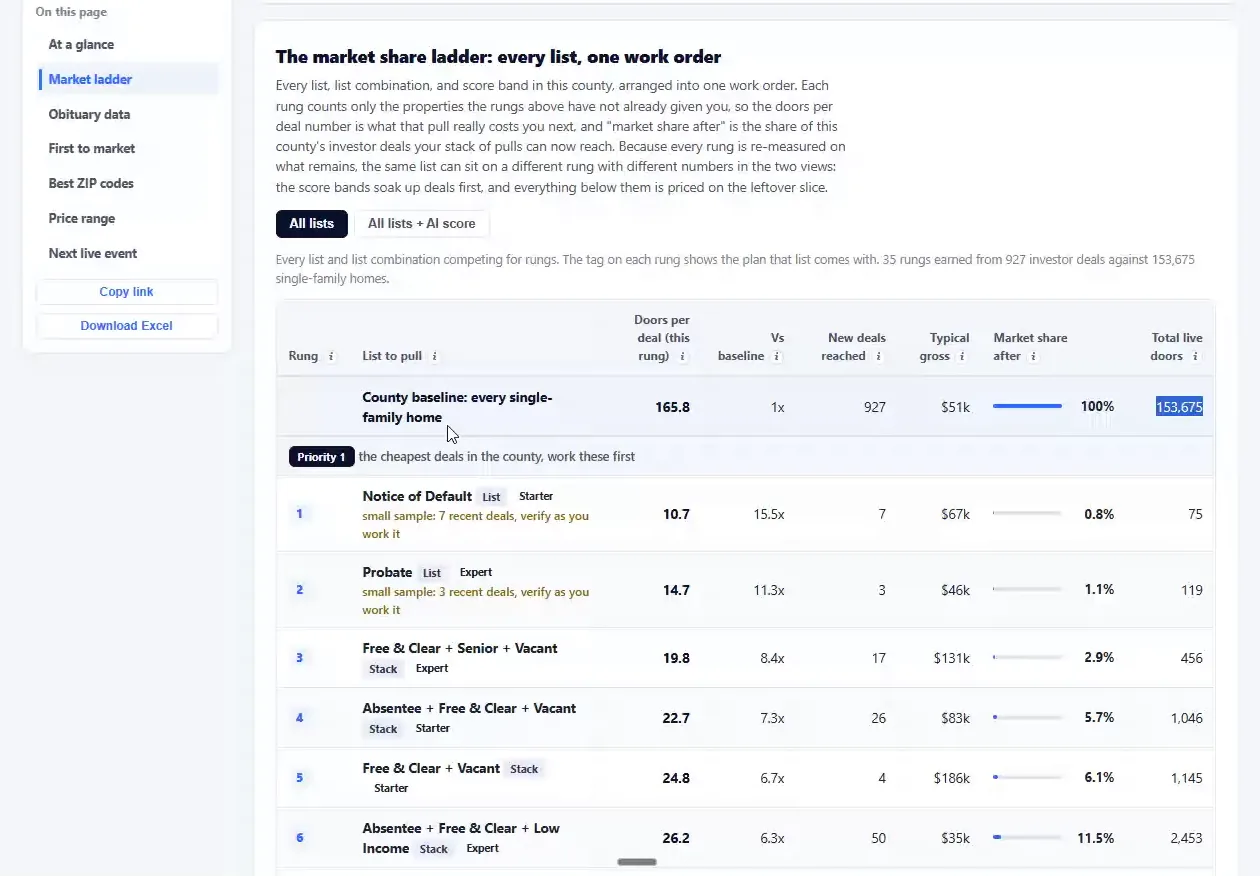
Free and clear plus senior plus vacant stacks into one list you pull straight from SiftMap and market the same day. Notice of default and probate I pull from the county, which takes a process to stand up.
Probate runs long. Courthouse record to a lead under contract averages four to six months. Foreclosure moves faster. Free and clear can close inside a week if you reach them and they are motivated. Running both is what makes deal flow steady instead of lumpy.
That free and clear senior and vacant, if we get them on the phone and they are actually motivated, can close out within a week. And that is what keeps a lot of the cash coming in the door while we are also building our pipeline.
Small samples.
Read a small sample as thin evidence, not a bad list.
Rungs carry notes like three recent deals, verify as you work it. That is the ranking telling you it is thin. Counties also have missing coverage on some lists, and the page says so.
Say notice of default or probate shows a small sample. Work it from SiftMap and pull the county data yourself in parallel.
BEFORE YOU MOVE ON
PART 3
How the lists stack.
Every rung counts only the properties the rungs above have not already given you. That is what makes the order worth following.
Cutting the list.
Read what rung one costs.
Notice of default in Knox County: 75 properties meet the criteria. Typical gross profit around $67,000, at just under 1% market share. One deal every 10.7 properties, against a blind baseline of 166.
Add probate and the list goes 75 to 119. Market share moves 0.8% to 1.1%. You are now in front of 10 total deals.
Expect the jump at rung three.
Free and clear plus senior plus vacant takes the stack from 119 to 456 properties and market share from 1.1% to 2.9%. Rungs one and two are cheap and small. Rung three is where the volume arrives.
Use typical gross profit to size the offer.
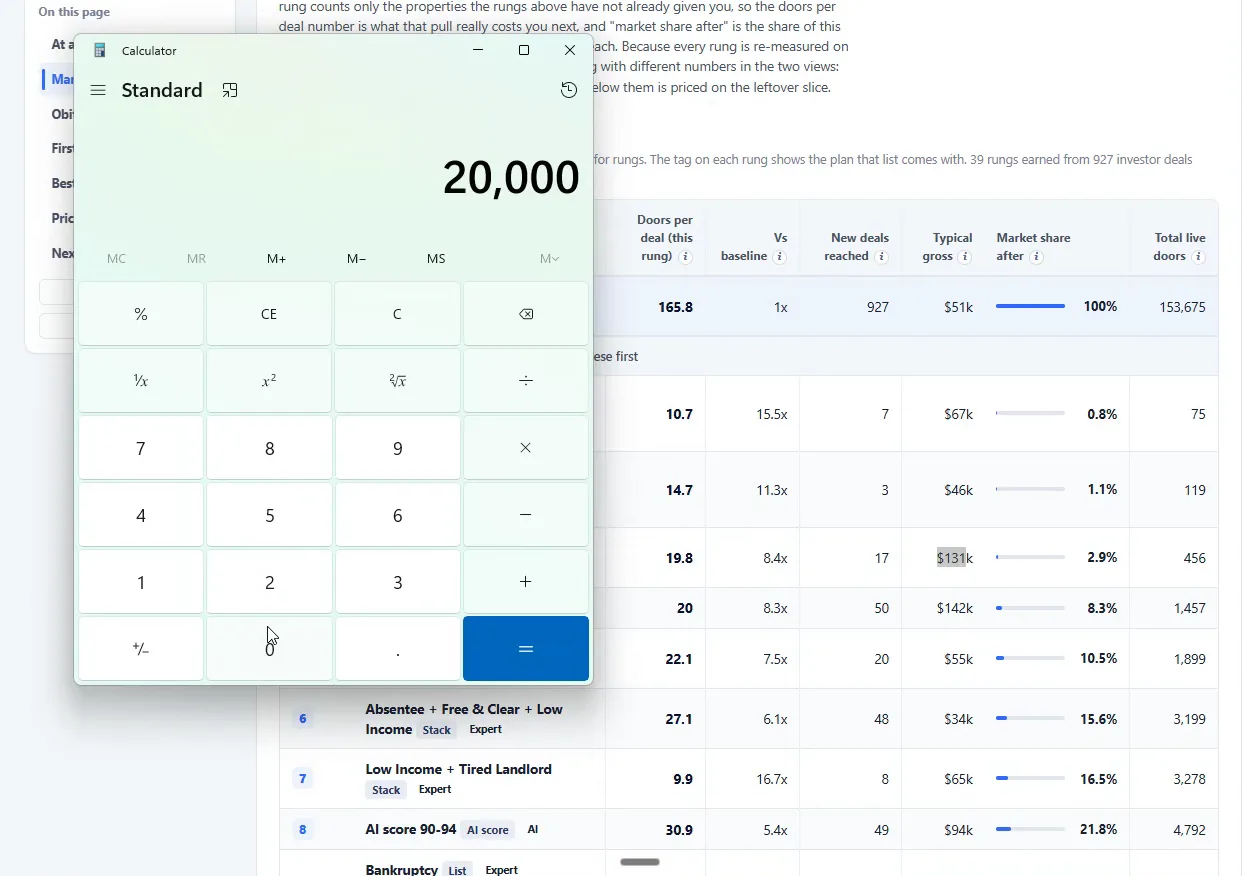
Notice of default runs about $67,000. Probate $46,000. Free and clear plus senior plus vacant $131,000. AI score 95 plus $142,000.
Worked on the recording: a $200,000 property minus the $131,000 typical gross means those sellers land around $69,000. That is an offer range before you dial anyone.
Non-disclosure states do not get this column, because the sale price is not published. Texas is the example.
Compare a broad list before you talk yourself into one.
Absentee as a plain broad list runs one deal every 3,453 properties, and those buyers typically pay market value. Negative equity, low equity and broad high equity behave the same. Bigger lists, smaller deals.
Foreclosures, vacants, low income and tired landlords sit at the other end with much bigger deal sizes.
Go deep on a small list, not wide on a big one.
At the time of filming I was marketing to 1,457 properties across call, voicemail, text, direct mail, email and door knocking. All six channels, one list. Out of those, on average every 20 properties sells in the next six months.
Cost per acquisition on that runs $1,000 to $2,000. Pull 10,000 from a data tool and mass market and every touch is low quality with nothing behind the decision.
PART 4
The turnover math.
Lists turn over. Once you know the rate you stop buying data you do not need.
Market turnover.
Check what the full stack is worth.
Take the stack out to roughly 3,200 properties. That is about 15% market share, and one transaction every 27 properties over the next six months.
Then the number most people never look at. That list changes 5% to 10% every month as people sell and new people qualify onto it.
Sizing the list.
Multiply your list by the middle of the turnover range.
Take 7.5%, the middle of 5 to 10. Multiply 3,200 by 0.075 and you get 240. That is how many genuinely new properties join every month, and it is the real size of the ongoing job.
Work the 3,200, absorb the 240, and a handful of callers covers it.
You do not really need that net new 10,000 that a lot of the industry is kind of anchored to actually get the consistency.
BEFORE YOU MOVE ON
PART 5
Obituary data and the probate timeline.
Obituary data is not on the market ladder. It gets its own area, because it is the hardest list to reach and the least competed.
Obituary data.
Treat obituary data as its own lane.
Filings get scraped nationwide every day, transformed, and tied to a property address. Once the address is attached you know a probate is probably coming.
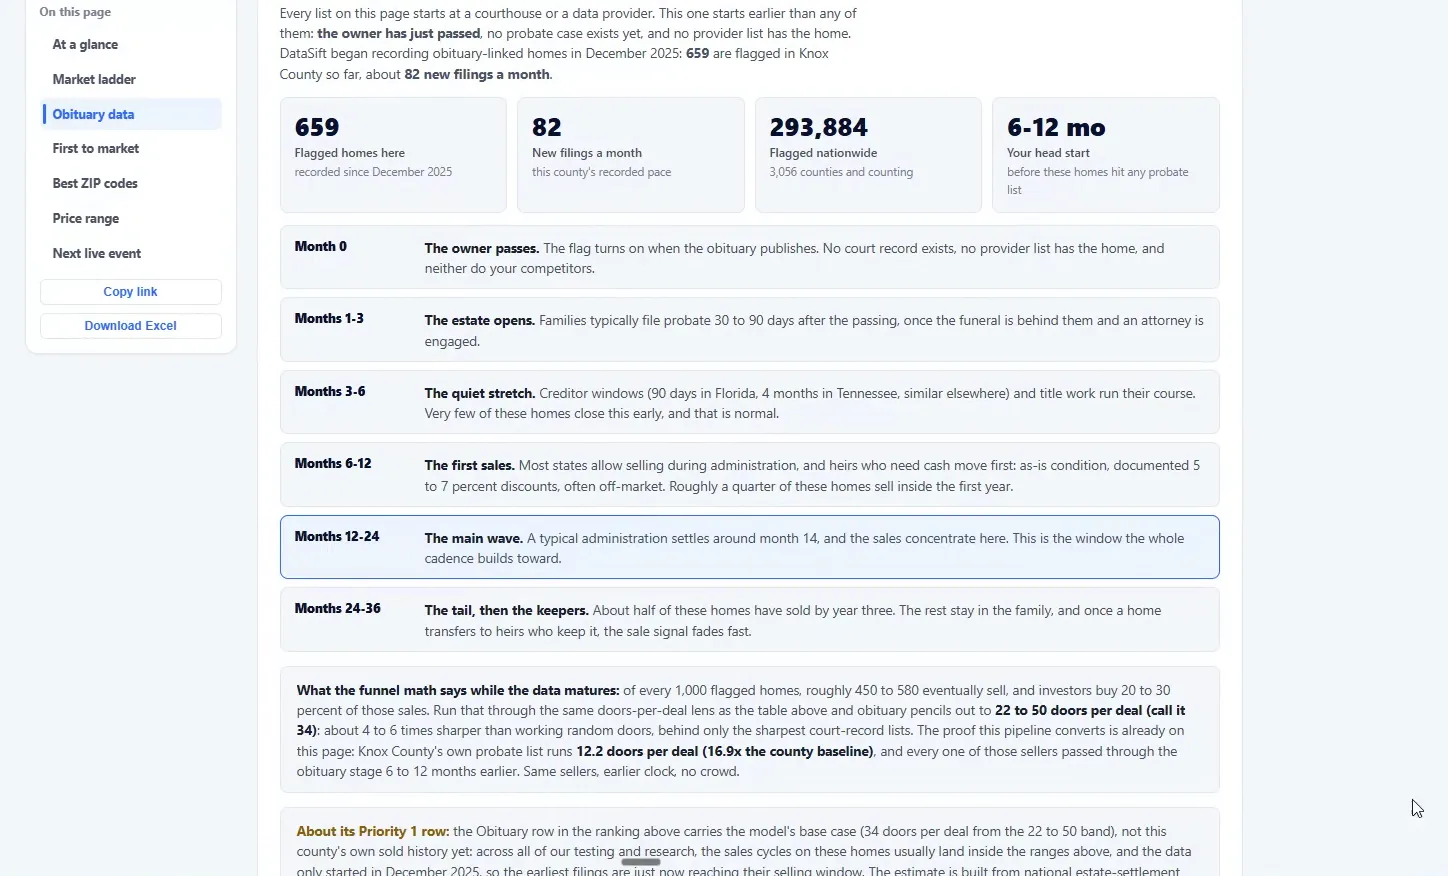
In my market that is about 82 new filings a month. Across the whole feed we have tied 293,000 parcels since December 2025.
The probate timeline.
Learn the first six months. That is where you enter.
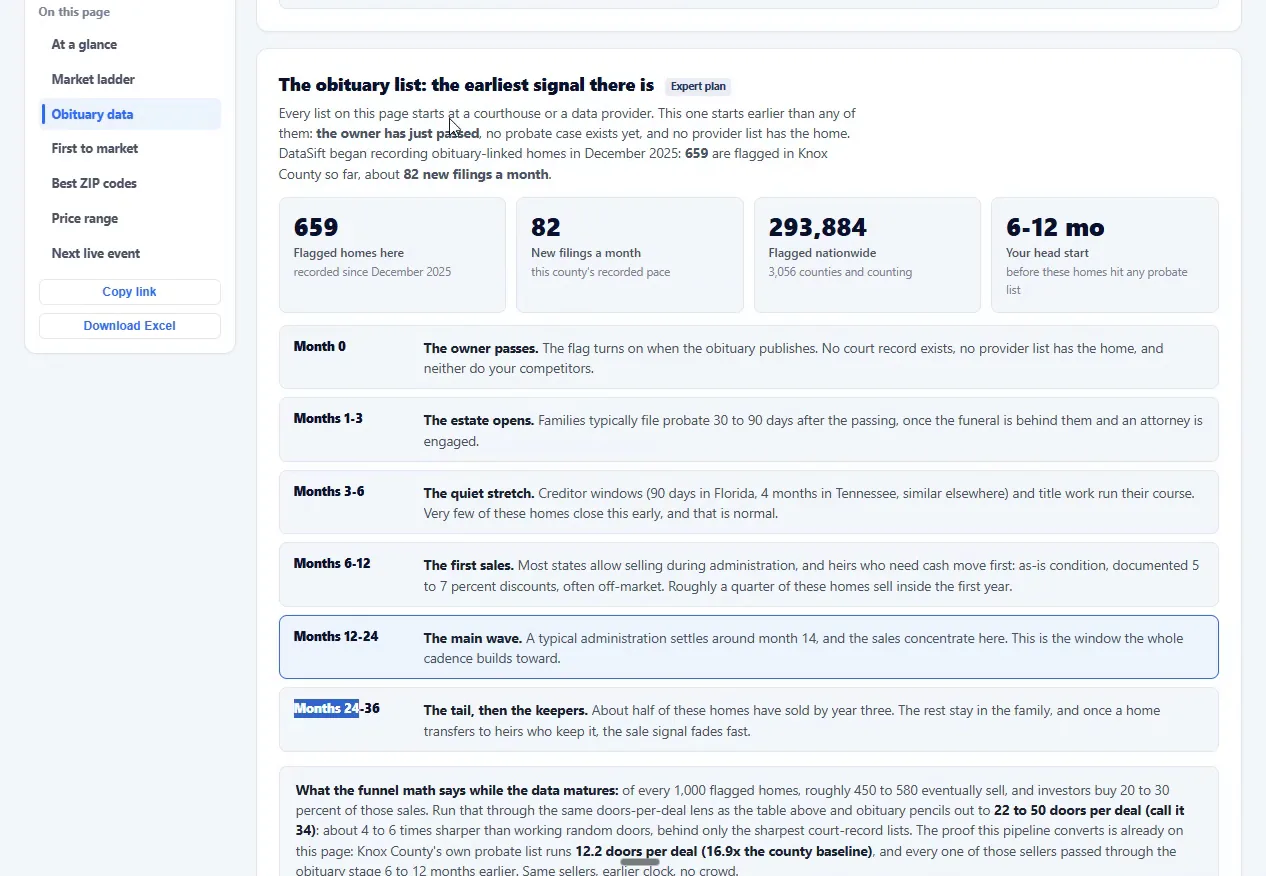
Month zero the owner passes and nothing happens. Months one to three the family starts probate, which takes 30 to 90 days. Months three to six the creditor windows open and the court notifies everyone tied to the estate debt, the mortgage holder first.
Understand why the list converts.
Most families cannot catch the debt up, so they sell and clear it out. Sales start months six to twelve. Months six to 24 carry the vast majority of transactions. Past the two year mark they are planning to keep it.
Build the campaign off the date of death.
Every record carries the exact filing of the date of death. Market to anyone past the three month mark and you arrive as the person who helps them through probate, before anyone else has the record.
Look for the records that stalled.
An obituary flag, six or more months elapsed, and the property still has not moved through probate means something is wrong. Back taxes, a foreclosure starting, a vacancy, creditors circling. Most families do not know what the probate process even is.
That is the curative title play. Least competed list on the board, because it is the hardest one to reach.
This is kind of one of the best performing lists that we have ever found.
PART 6
The first to market workbook.
One button gives you every list, where the records live, who runs that office, and what it takes to pull them. The heavy lifting is done.
First to market.
Click Download Excel and open the first to market tab.
The workbook mirrors the page: the doors per deal summary plus every list broken out. It is built to hand to a team member or a VA who will do the pulling.
The first to market tab is where the research already happened. Per county, where each list lives, how to pull it, and the priority order to pull it in.
Cross-check a strong rung against its coverage.
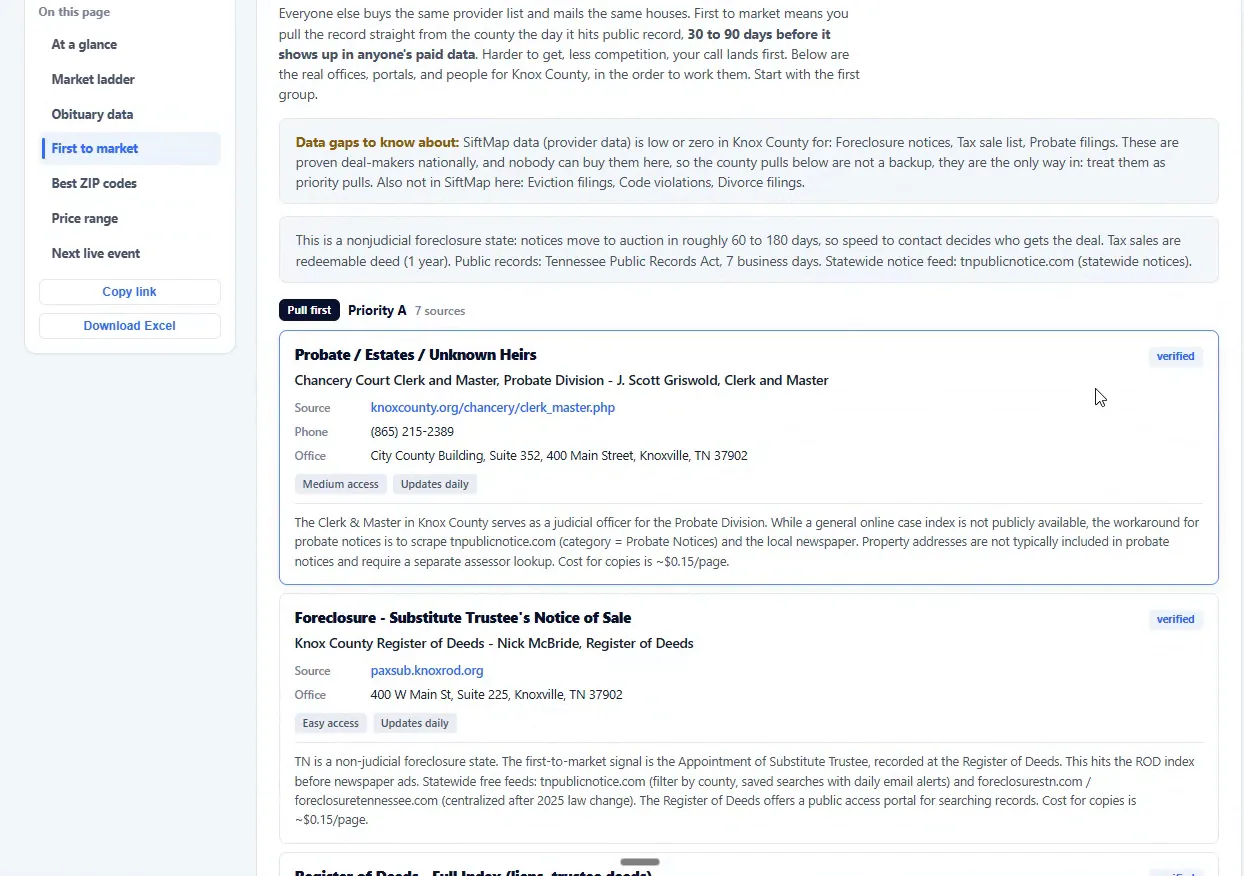
Probate and notice of default both show excellent doors per deal in Knox County. Both also show low coverage. A great ranking on thin coverage is the case for pulling that list yourself.
Reading the county notes.
Read the notes column. It holds the workaround.
The columns give you data type, the office the record lives in, and who oversees it. Then phone, source link, office address and an email. Then access difficulty, how current it is, and whether we verified it.
For Knox County probate the note is specific. The clerk and master serves as judicial officer for the probate division. No general online case index is public. The workaround is to scrape tnpublicnotice.com under public notices.
It also warns that probate notices usually omit the property address, so you need a separate assessor lookup. Copies run about 15 cents.
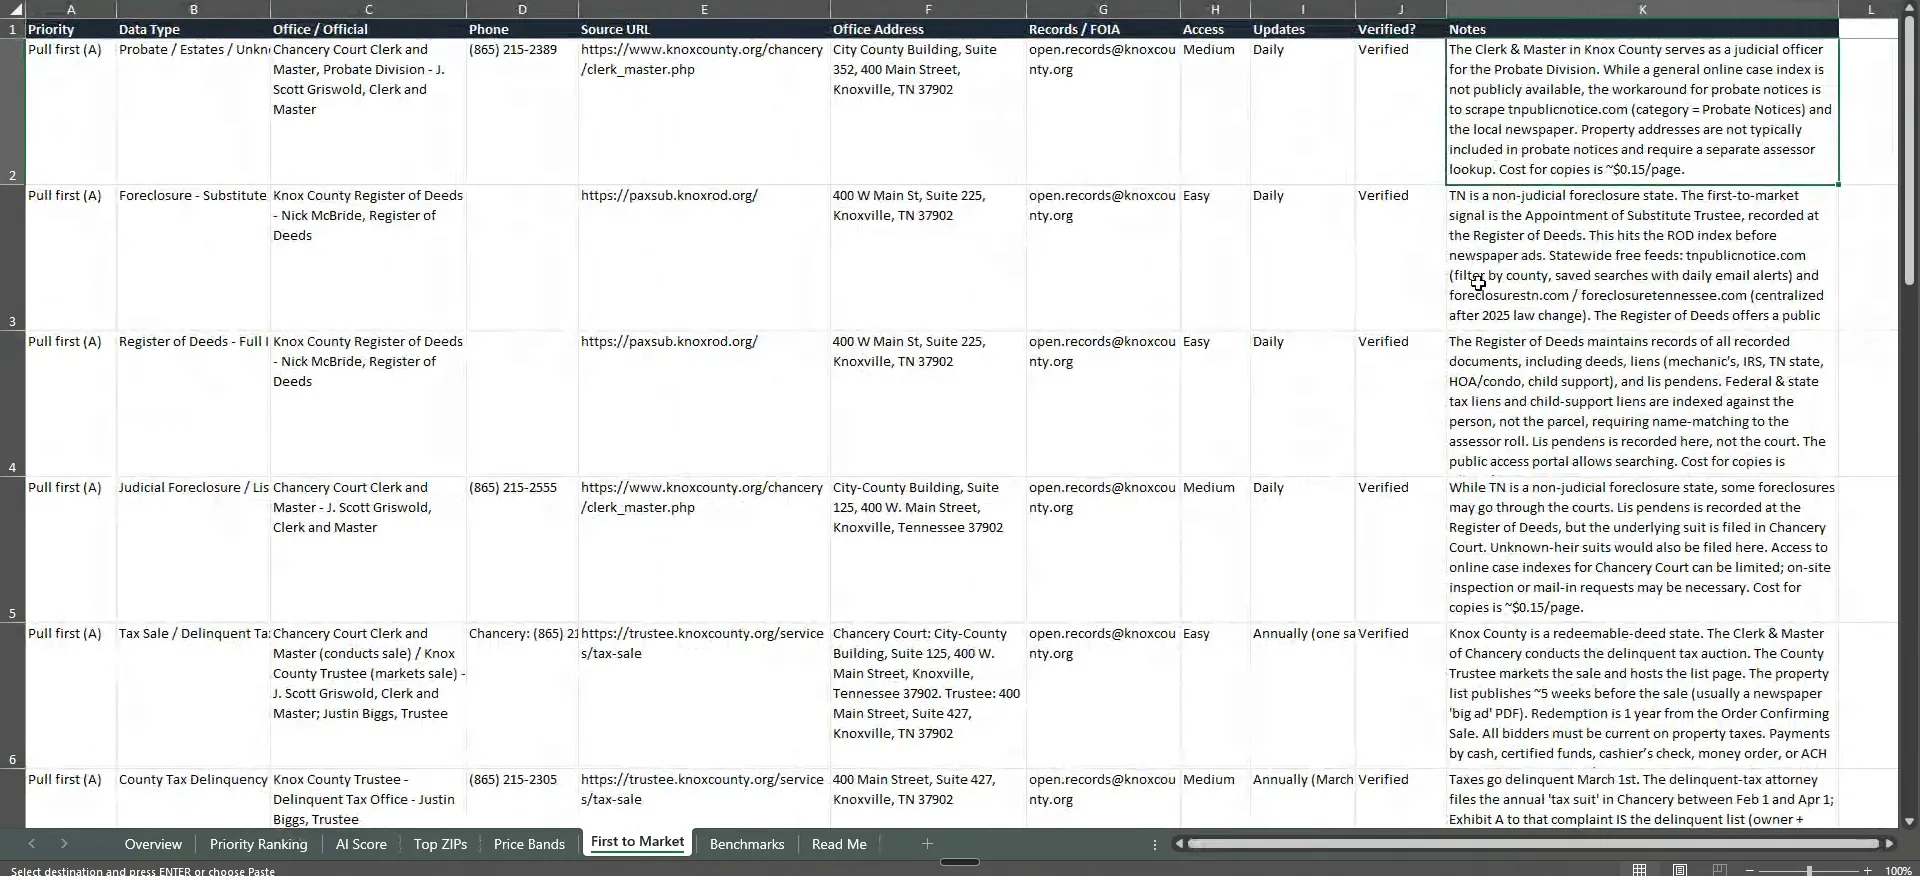
Hand the workbook to Claude and have it build the pull plan.
The Excel is structured, so it makes a good input. Give it to Claude and have it write the execution plan for pulling each source into your account.
PART 7
Your first steps to marketing.
One list you market now, one process you start building.
Worked example.
Subtract the rungs above to get your net new list.
Free and clear plus senior plus vacant shows 456 total. Notice of default plus probate above it is 119. So 456 minus 119.
337 properties. That is the campaign you stand up today while you build the courthouse pull for the two rungs above it.
| Rung | List | Total | Net new | Move |
|---|---|---|---|---|
| 1 | Notice of default | 75 | 75 | Build the courthouse pull |
| 2 | Probate | 119 | 44 | Build the courthouse pull |
| 3 | Free and clear, senior, vacant | 456 | 337 | Market this now |
Open the workbook and find where your two rungs live.
Probate points at tnpublicnotice.com. Foreclosure points at the same place. Tennessee is a non-judicial foreclosure state, so the first signal is a substitute trustee appointment recorded at the register of deeds. That hits the deeds index before the newspaper ad runs.
So the week is: start the pull for those two, and market the 337 today.
ZIPs and price range.
Set a price band wide enough to work.
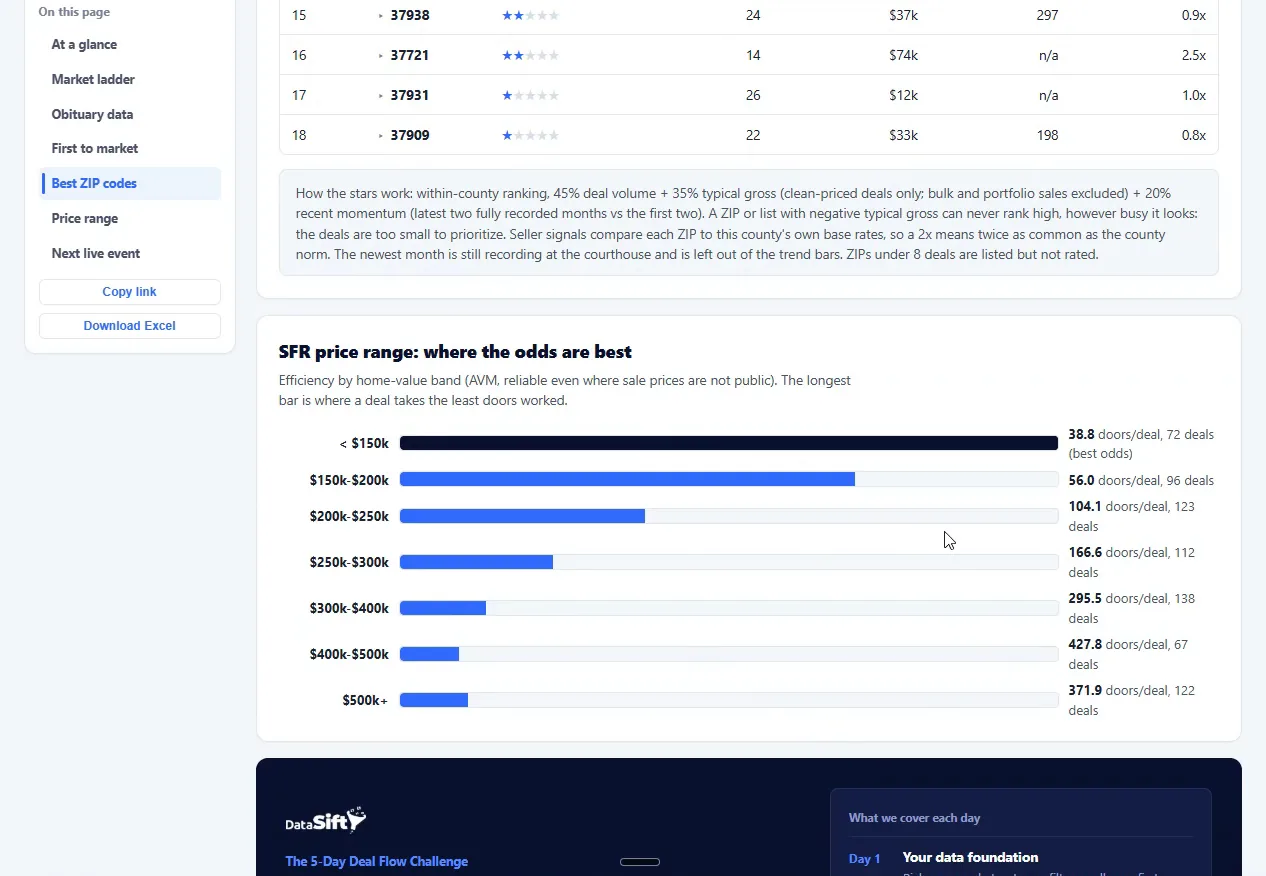
The ZIP view narrows a list that got too big. The price range view is the buy box. For me that runs $100,000 to about $600,000.
In Knox County the $150,000 band is the most efficient on doors per deal. Above $500,000 far fewer owners will sell to an investor at all.
YOUR FIRST WEEK