
PART 1
Which ZIP codes matter.
We have 40,000 records in this county and I want to get in front of the best locations first. So we are going to read the ZIP code map, check the median sales price, and cut down to the top 5,000. Along the way you will see two ZIP codes where the data is telling you something odd.
Cut the list down to top 5,000.
Narrow 40,000 records down to your top 5,000.
I could go cold call through all 40,000 of those records. I would rather get in front of the best locations first. So we look at the area and figure out which ZIP codes have the most opportunity.
Thankfully there is not a ton of ZIP codes here. That makes this a quick pass, not a research project.
Check the median sales price behind every dark color.
We are already filtered to single families in Market Finder, at 125 to $475,000 in value. Then I look for the areas with the darker colors. Dark color alone is not the answer.
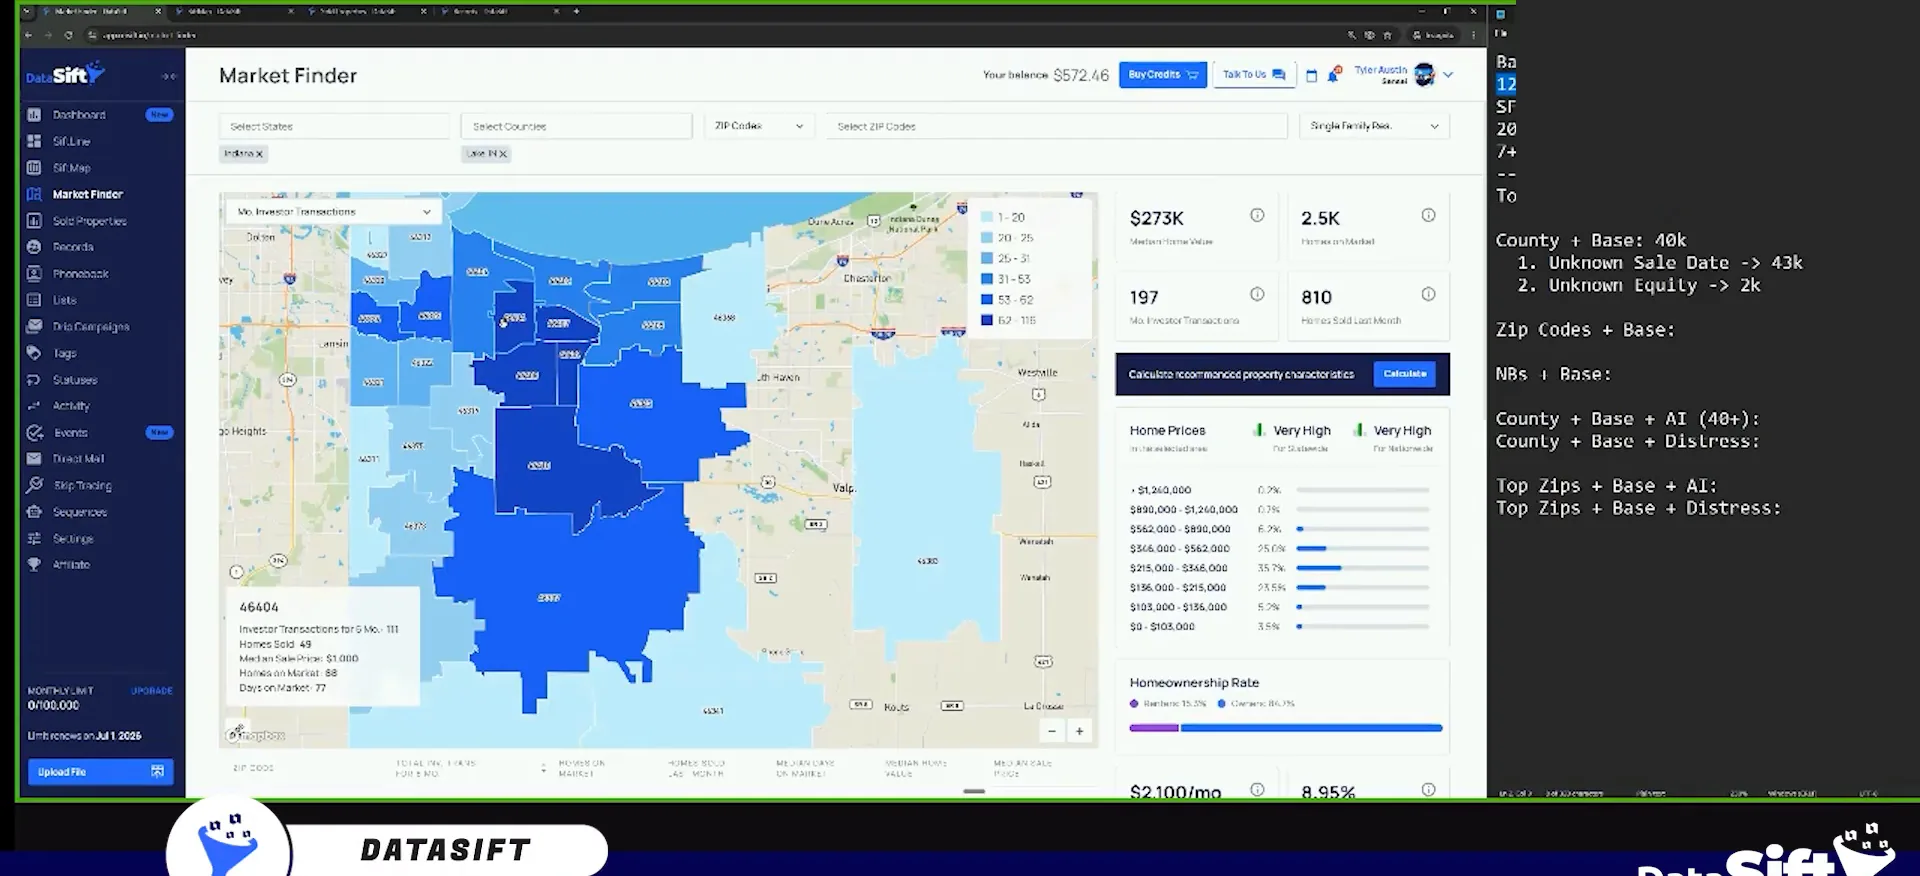
This one shows 111 investor transactions and a median sales price of a thousand. That is most likely wrong. Something is going on with the data in that ZIP code, or it could be a lot of auction stuff.
That is uncertainty, or lack of confidence is what I will say. I would want to look at that better inside of SiftMap. For now I stick with the areas where I can tell there is activity going on.
But just because it has dark colors, in this case, this is a 111 investor transactions, but it says median sales price a thousand.
Divide 66 transactions by six months before you commit.
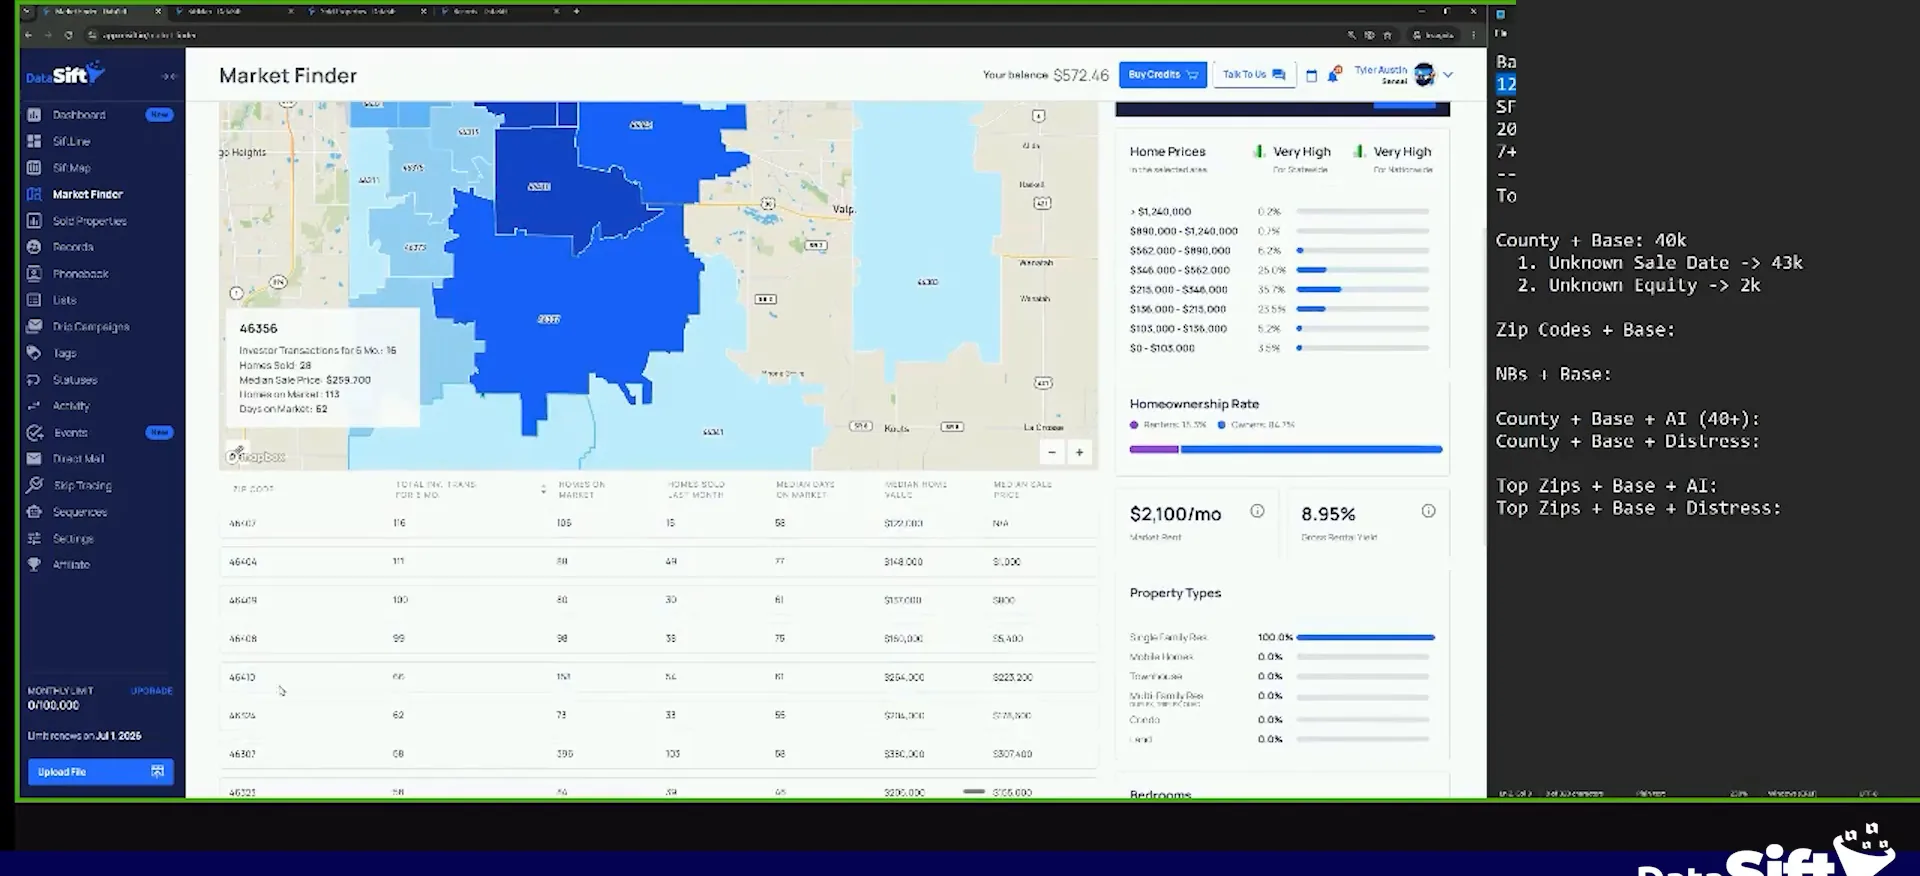
46410 clearly looks great. I find it on the bottom map and it is right here in the table, the fifth ZIP code in the row. It has 66 investor transactions and that is over six months.
So 66 divided by six gives us 11 transactions a month. That is a lot of transactions going on in that area. That is plenty of opportunity to get deals out of.
Then I look at homes sold last month against homes on market, because I want to understand my demand. One fifty eight divided by 54 gives me three months of inventory, which is great. And the median sales price and the home values are within my AVM.
Investor transactions
Two numbers tell me if a ZIP has activity.
A dark color on its own is not activity. I look at the transactions and the price together.
It is a huge tax sale area.
Ask someone local why a ZIP code looks odd.
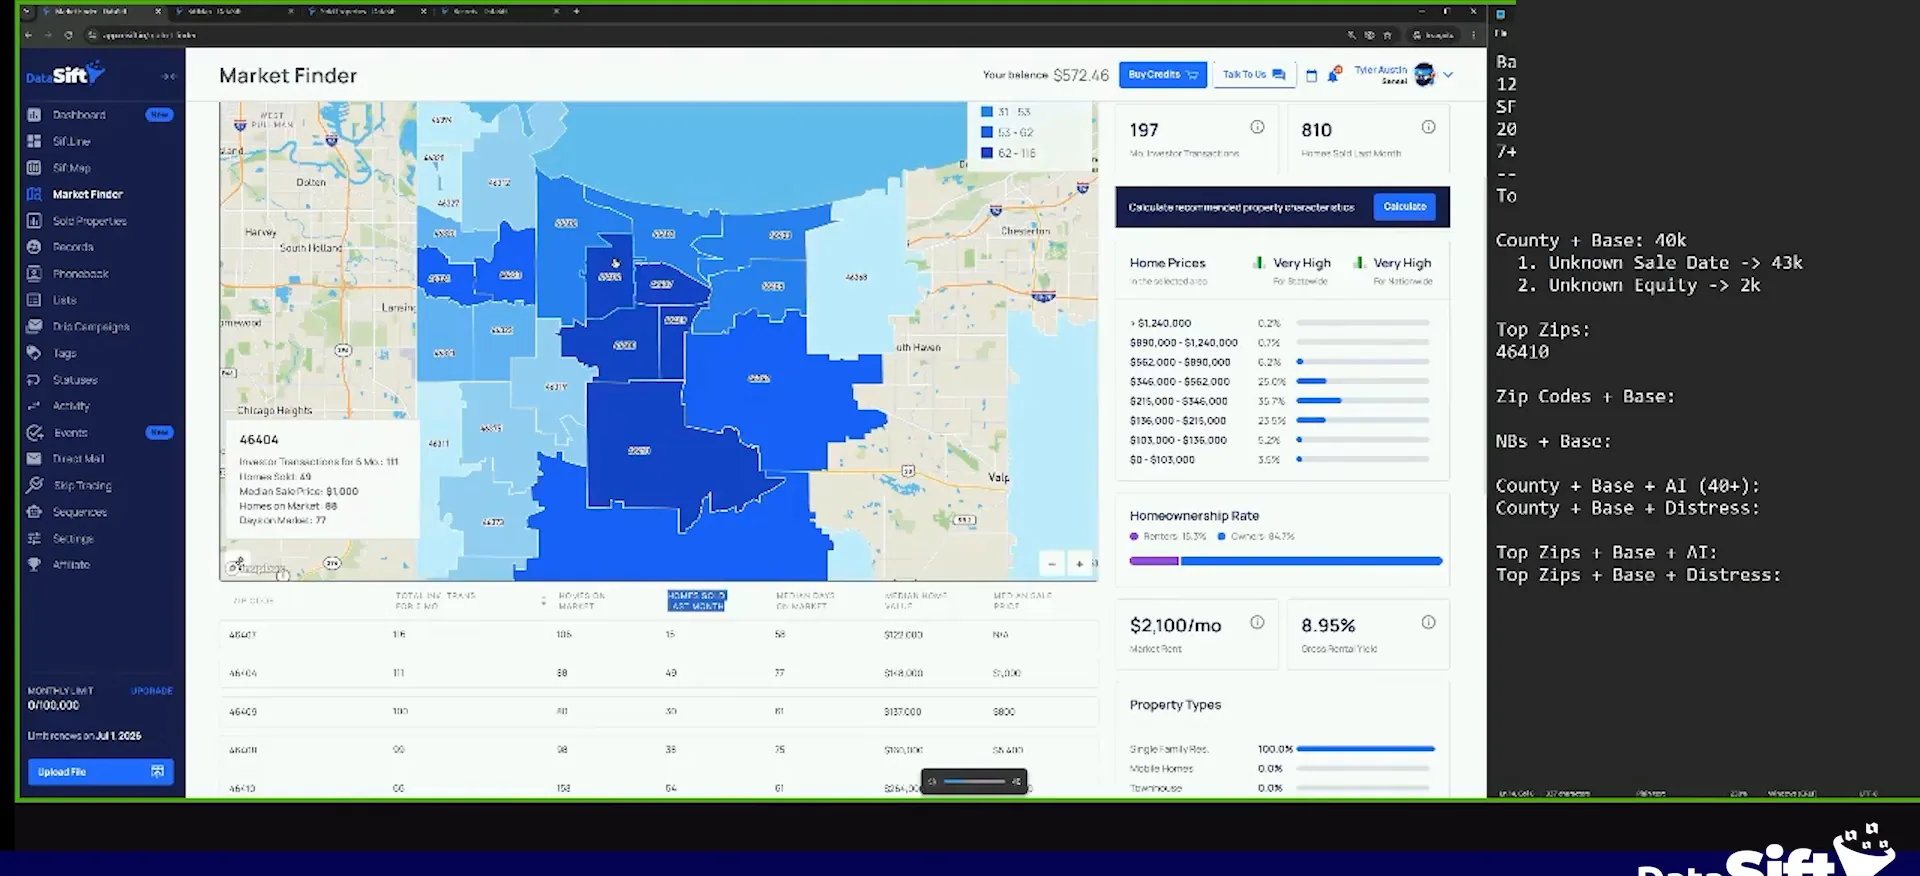
That ZIP code looks good, so we start a list here called top zips and we put 46410 in it. Then I asked Greg, who has been investing in this area about twenty years, why the 404 ZIPs got weird.
His answer was that it is a huge tax sale area. They have a lot of tax sales there. That is why that number is at a thousand, and he confirmed rental demand there is very high.
It's almost would mirror, Detroit, some of your other areas, so you understand why that number is at a thousand.
Skip the tax sale ZIPs for outbound marketing.
We want to know that and understand it, because I probably do not want to pull data there. I am not going to make any money marketing for return there, most likely. There are a lot of transactions in that area, but they are not my kind of transactions.
These other areas here seem to be more of the established kind of areas. That is where I want to spend some of my time and energy.
I could just buy it from auctions, and there's probably a lot of other ways I can get deals there rather than direct to seller outbound.
Where not to pull
Two kinds of ZIP codes I skip.
Tax sale area
- ZIP code404
- What the data saysLots of transactions, price at a thousand
- Why I skip itI could just buy them from the auction
No investor transactions
- ZIP code46341
- What the data saysMuch higher median sales price
- Why I skip itMaybe newer houses being built there
Pass on ZIP codes with no investor transactions.
Look at 46341 down here. It has a much higher median sales price, but we are not tracking any monthly investor transactions there. That could be more new construction, maybe newer houses being built.
It is not to say that there is nothing there. But if we are not catching it, then it is a little bit less likelihood. Looking at this market right now, I like three ZIP codes. I do not like any of the ones under a hundred thousand in value.
BEFORE YOU MOVE ON
PART 2
Pick the ZIP codes for mail money.
Now I pick the ZIP codes I would actually spend mail money on. Price point decides it, because a $307,000 area pays me better than a $150,000 one. Then I run the same pass at the neighborhood level.
My top three ZIP codes.
Pick your top three ZIP codes by price point.
Those would be, like, my top three ZIP codes, because they have a little bit higher price points. A couple of others further up the list are still inside our range, and they would be good too.
But if I filter by the top three and it comes back as, say, 10,000 properties, I am not adding those two in. I would rather put myself in a position to make more money from the deal.
Judge each ZIP by what a deal pays you.
If I am marketing to a $307,000 median sales price area, I know I can make a 30 k wholesale off of that. It is a lot more difficult to do that off of a $150,000 property. It is not impossible. We do it a lot out of Duval County, a very similar kind of price point.
But we do not want to market only to the lower cost areas. Then we are doing a lot of work for a little bit of return. So we want to try to stay in that upper echelon if we can.
If I'm marketing to a $307,000 median sales price area, I know that I can make a 30 k wholesale off of $307.
Top zips
The zips I put on my list.
Add more ZIP codes only if you need records.
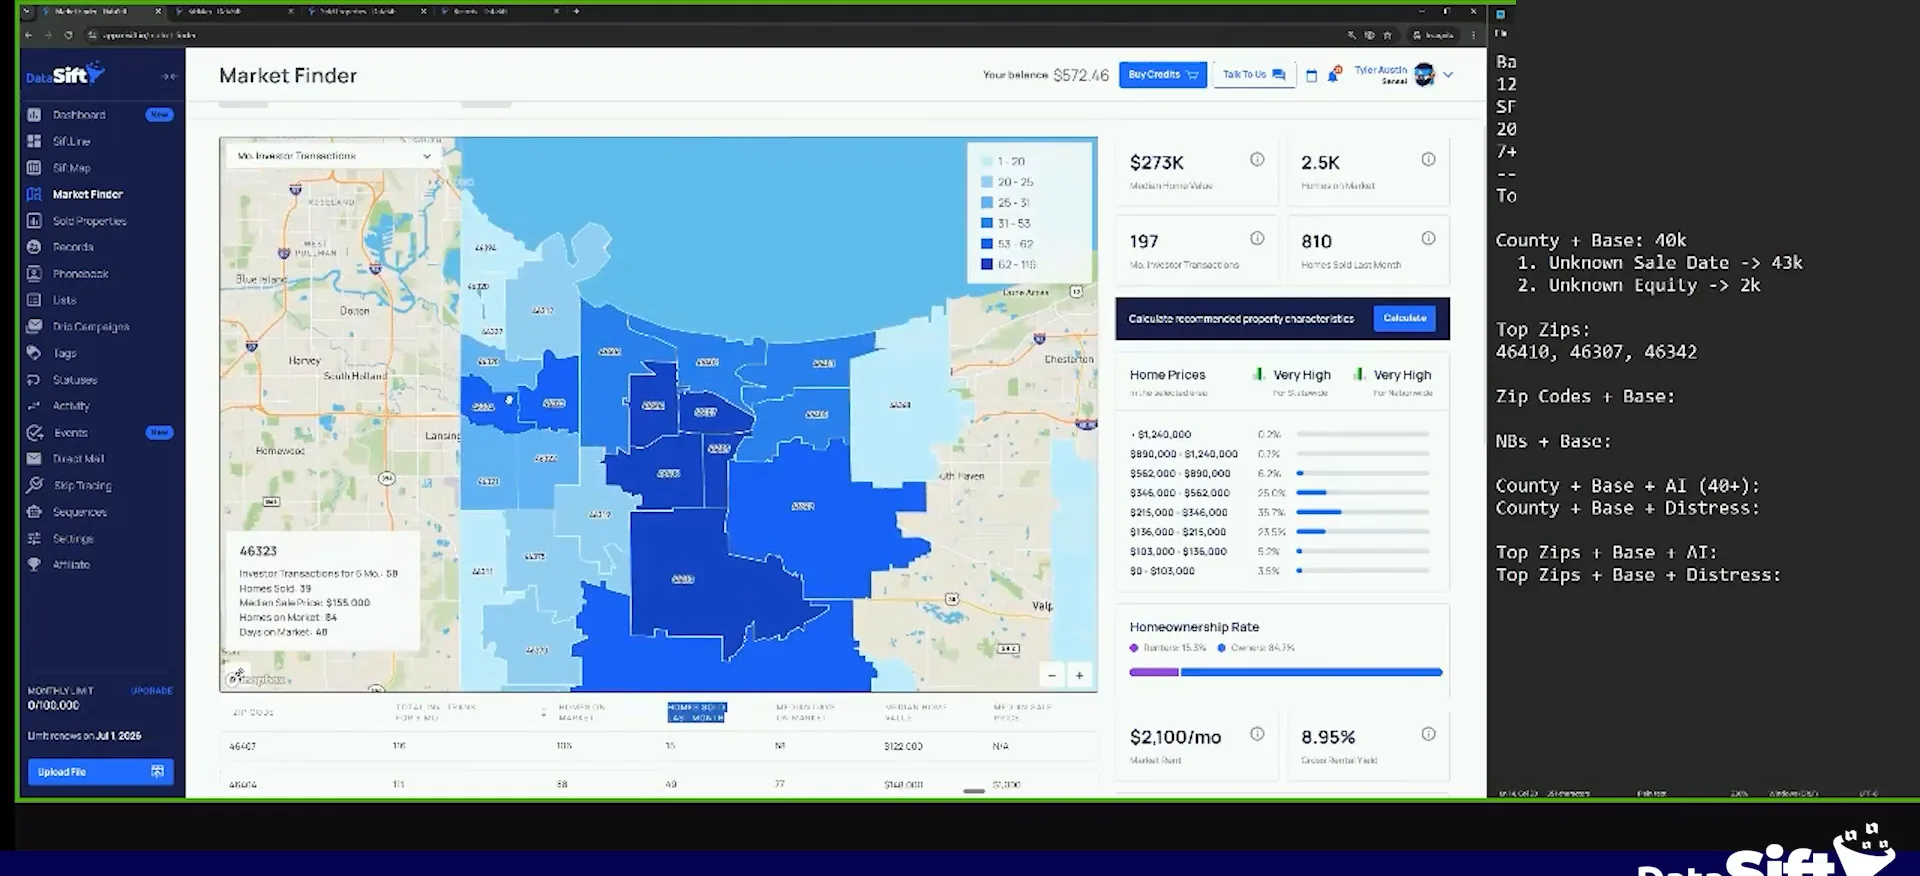
There are a few over here that are not bad, still inside our buy box. That looks like the only other one that is within the price range buy box we have. The ones over on the other side could be okay too.
There are less investor transactions there, but there is still plenty going on. This West Side here can still totally work for me. Maybe I would rather add three of those in and remove two of these.
This West Side here can still totally work for me, and I would be okay with adding those in if I needed more records.
We base it off of investor volume.
Rank on investor volume for now.
You are going to know what you would rather deal more in. In our concierge, I would take your last closed deals and the leads you are generating, and we would figure out which ones are best.
For now, let us base it off of strictly investor volume. That gives us a higher likelihood to wholesale deals, so we are going to keep with that.
Run the same pass at the neighborhood level.
We go through each neighborhood in these areas and try to find the top ones with price points that match our criteria. Looking down here at Merrillville Northwest, 13 investor transactions, 225,000, one month of demand.
Really good little neighborhoods here. That is the kind of line I am hunting for before I put any mail behind it.
Filter one neighborhood and count the properties.
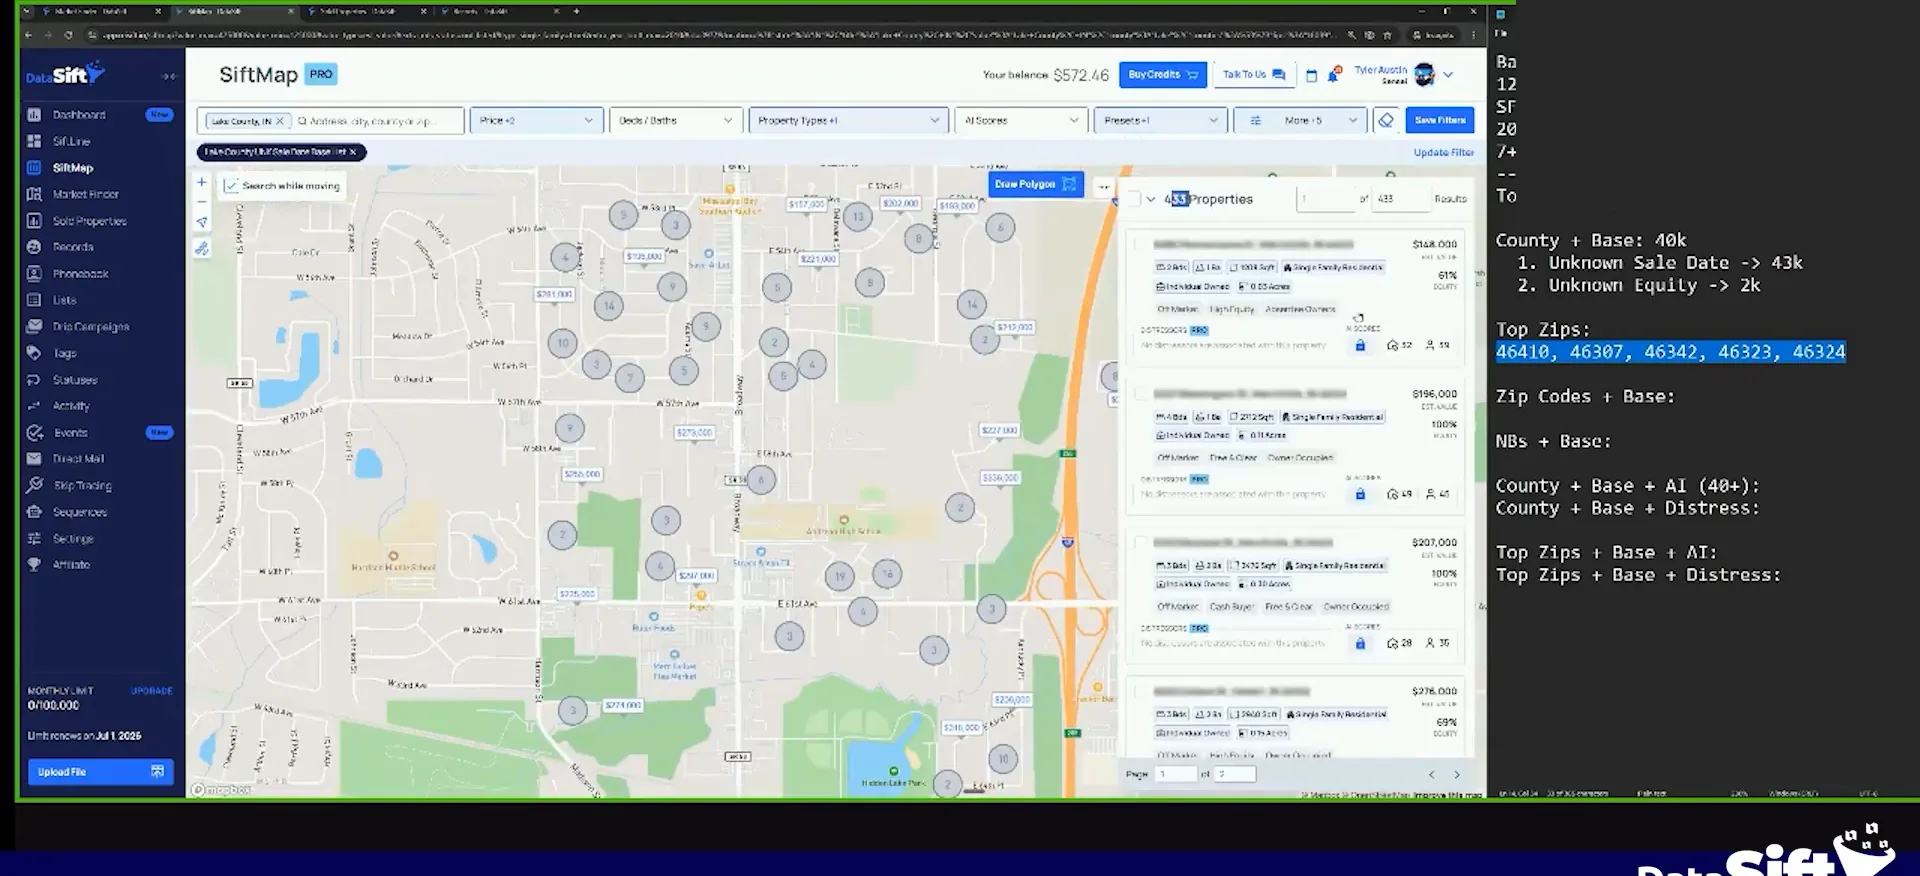
I will go to SiftMap and just add this neighborhood as a filter, one as an example. Properties that meet our base requirement of seven years of ownership inside that neighborhood alone is only 433. That is not enough to mail on its own.
So let us say I wanted to send $2,000 a month in mail. Then we get to about 3,500 or 4,000 properties in those top neighborhoods that I am just going to cherry pick.
I make a list of my top neighborhoods and build a buy box to just those. I want the ones with a fair amount of investor activity that prove to be a location that yields a nice return. I am not counting on a deal out of there every month, because that might not be realistic.
Well, let's get to, about 3,500 or 4,000 properties in those top neighborhoods that I'm just gonna cherry pick.
BEFORE YOU MOVE ON