
PART 1
Suppress the areas you do not want.
Most people rank neighborhoods from the top down and market to the winners. I go the other way and cut out the areas with zero investor transactions first. Then I build a short list of top neighborhoods and top ZIP codes on top of my base.
Suppress instead of picking the top.
Suppress every area with zero investor transactions.
The way I handle this from a marketing perspective is not picking out the best areas from the top down. We take the ones we do not want to be in, or that have zero investor transactions, and suppress them from all of our marketing.
That way, when we pull in market data or any other data from outside sources, the work is already done. It is much easier to suppress the areas you do not want across the whole account than to pick up the top ones every time.
Top neighborhoods and top ZIP codes.
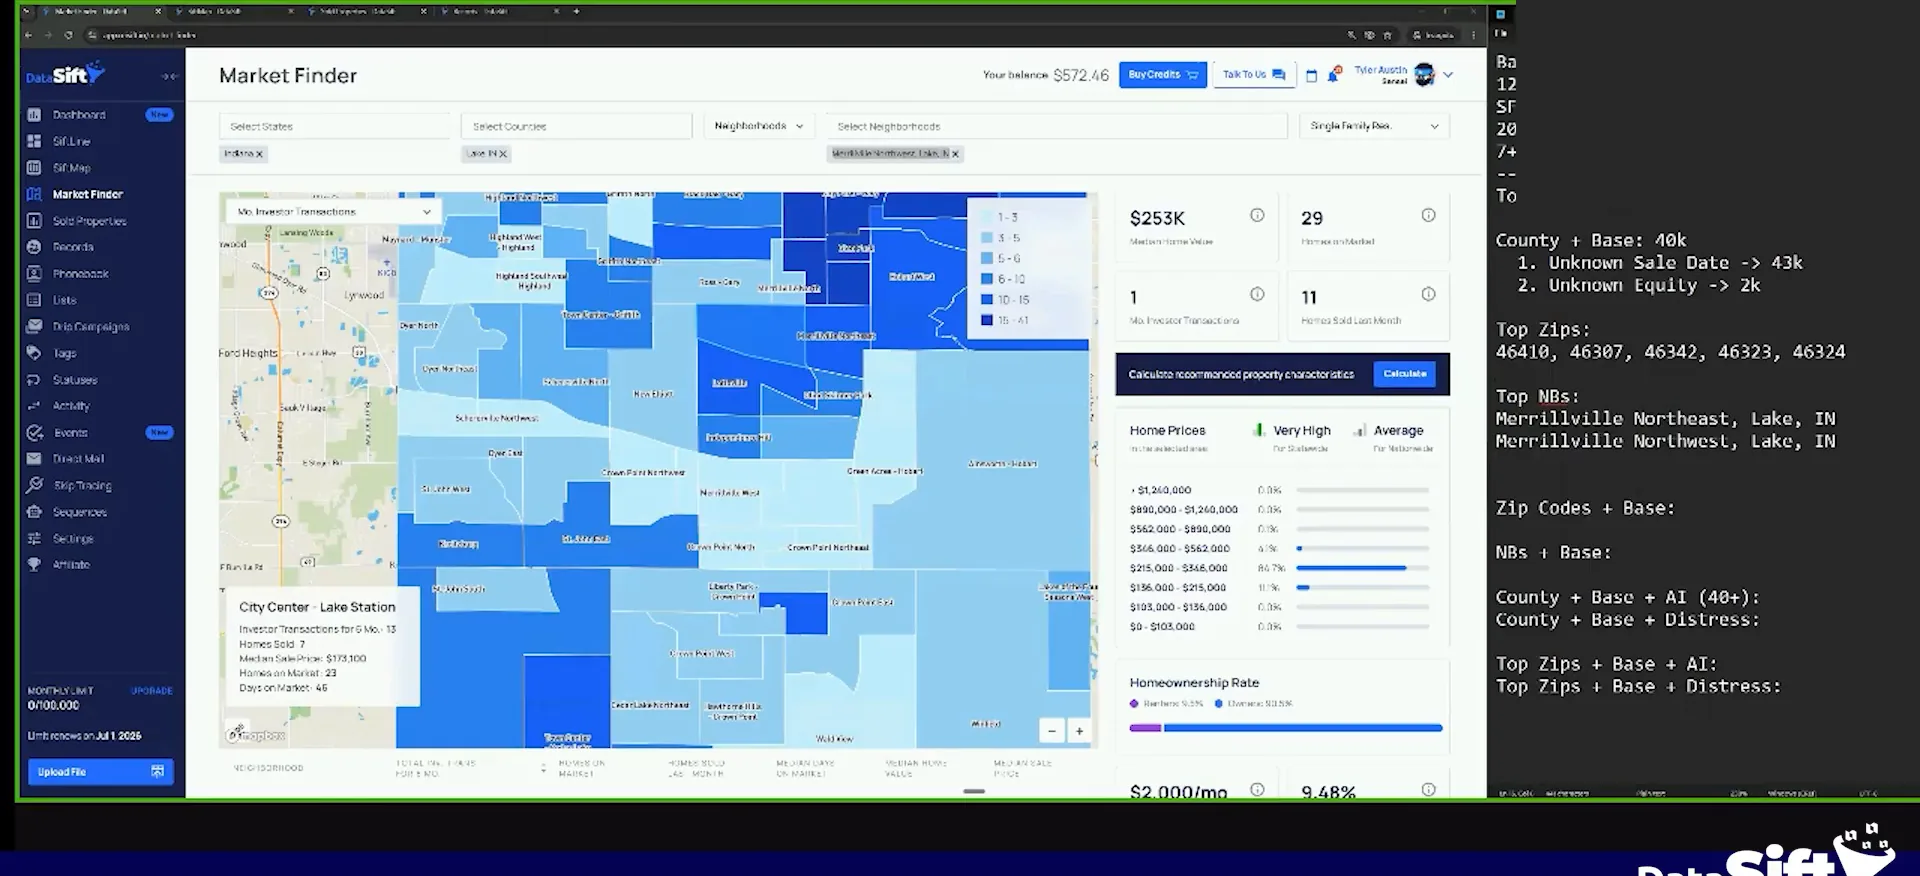
Add a few top neighborhoods from the map.
Build out your top neighborhoods as well. I grab at least one more neighborhood in another location so I am not stuck in one pocket of the county.
On this one I am looking at 14 investor transactions and three months of demand. Days on market is nice and low, so I like it. I add those three because we will use them later.
Zoom back out and filter by your base.
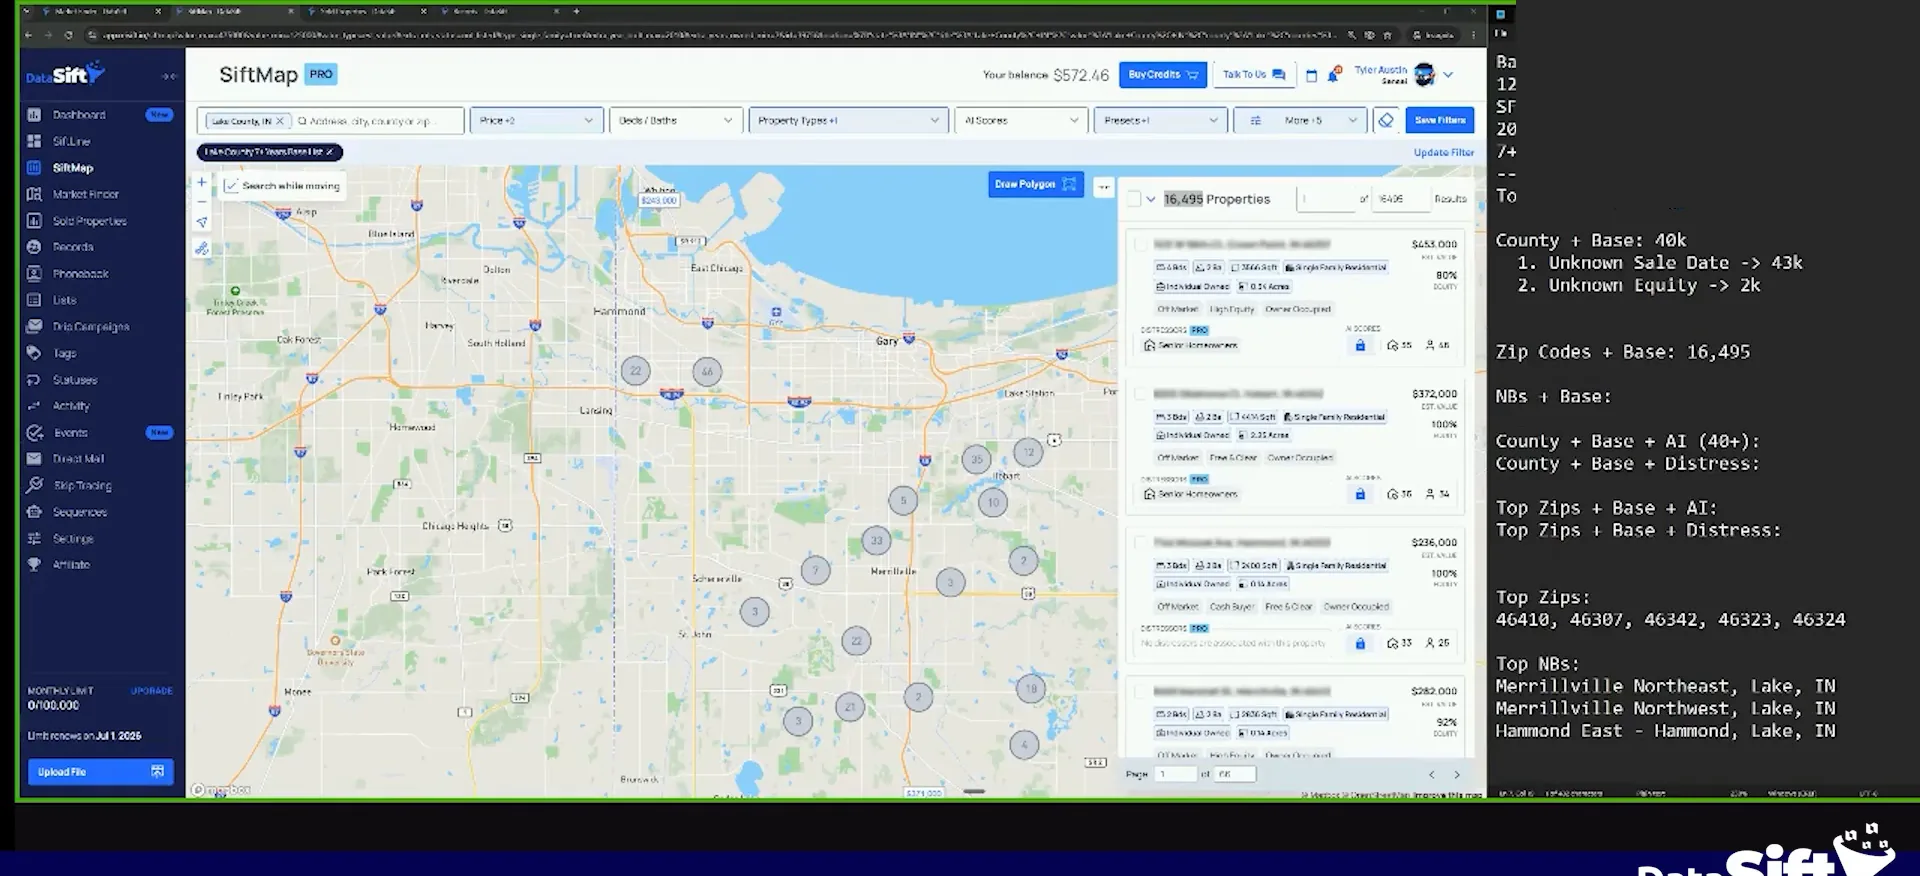
Go back to the map and zoom out to the county. Search the county so you are looking at the county level again.
Then filter by your base criteria. I am using my seven year base here, and that is the layer everything else sits on top of.
So let's go back to ZIF map here, and what we're gonna do is I'm going to zoom out back to the county.
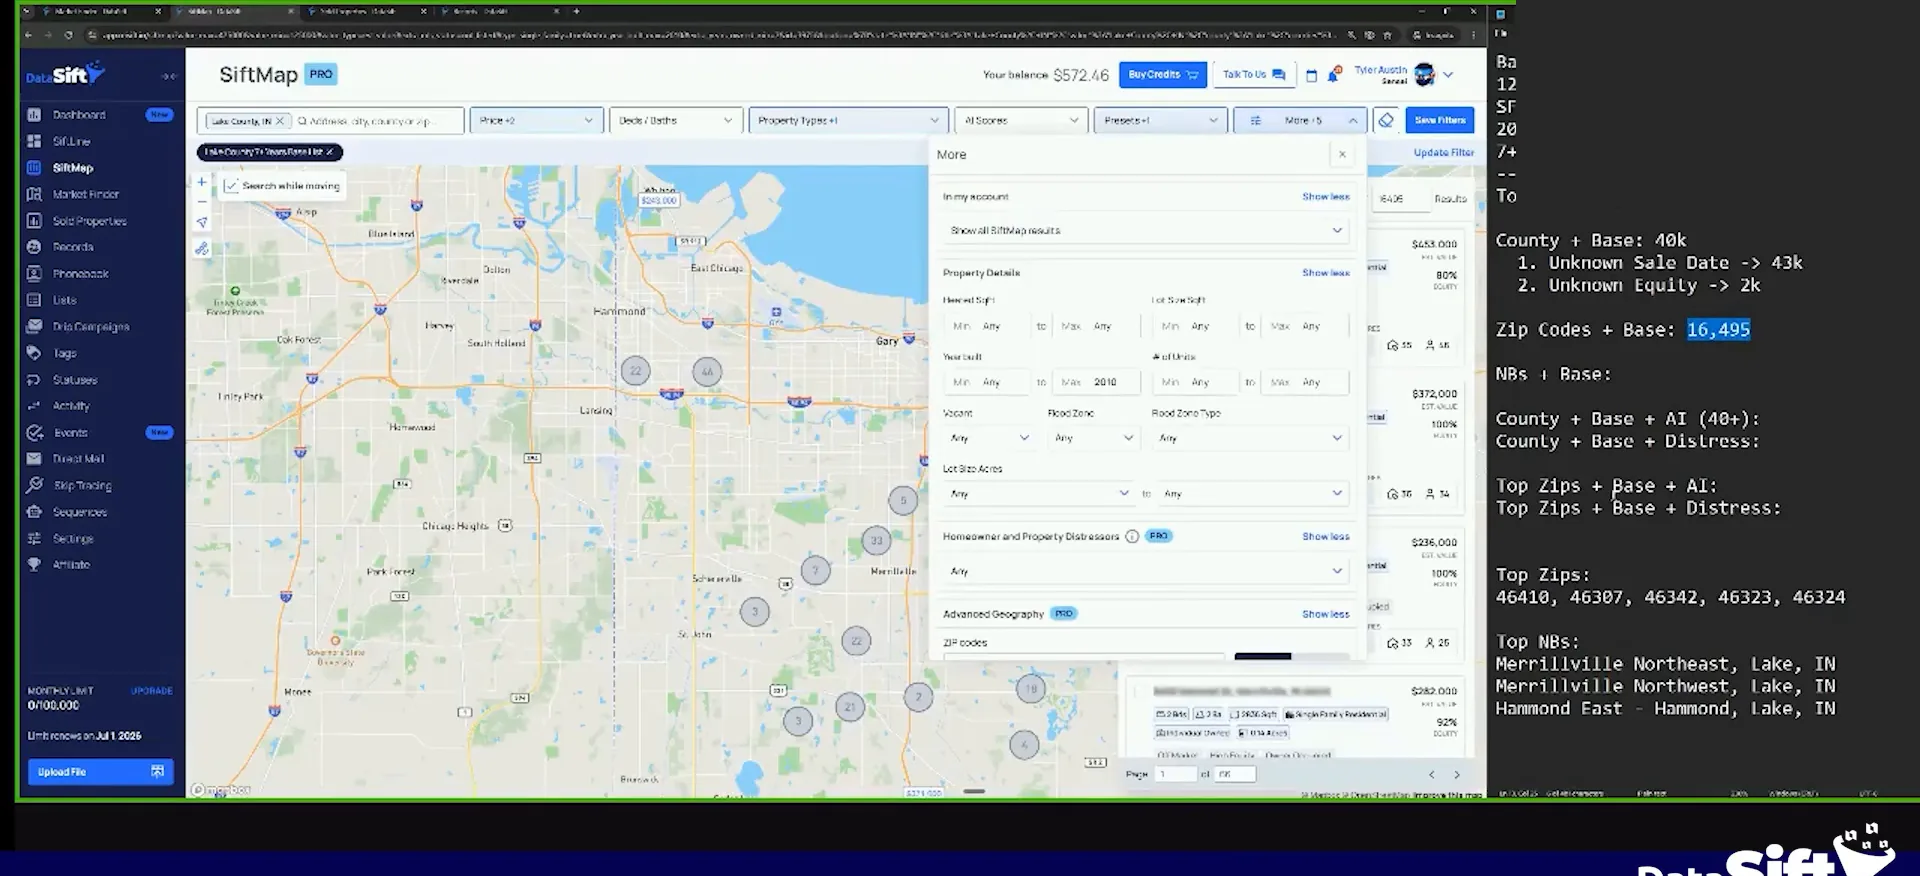
Add your top five ZIP codes and apply.
Click more filters and add the ZIP codes in there. Mine are 46410, 46307, 46342, 46323 and 46324. That is our top five.
Click apply and that gives us 16,000 properties in our top ZIP codes plus our base. That is plenty of records to start getting deals out of for a long time, especially once we start looking at some niches. If I want to add a little bit more later, that is fine.
Records
We go from 243,000 records down to 16,000.
BEFORE YOU MOVE ON
PART 2
Add the neighborhoods and spend per area.
Now I take the neighborhoods that still have investor transactions and decide what each one gets. Some get cold calling only, some get mail every month. Then I break the neighborhood down again by distress so the effort goes where it should.
Add the neighborhoods with investor transactions.
Add every neighborhood with real investor transactions.
These are the ones I add in, because there are investor transactions happening there. A fair amount of them too. They are not bad areas at all.
The lowest one is 20 over six months. Twenty divided by six is three investor transactions a month. I do not know that I mail that one. It might be 1,500 a month in direct mail and the return might not be there. I definitely cold call it.
I mean, the lowest one is 20 over six months, which means you're at least getting, what, two investor transactions a month.
Filter to your top three neighborhoods and count records.
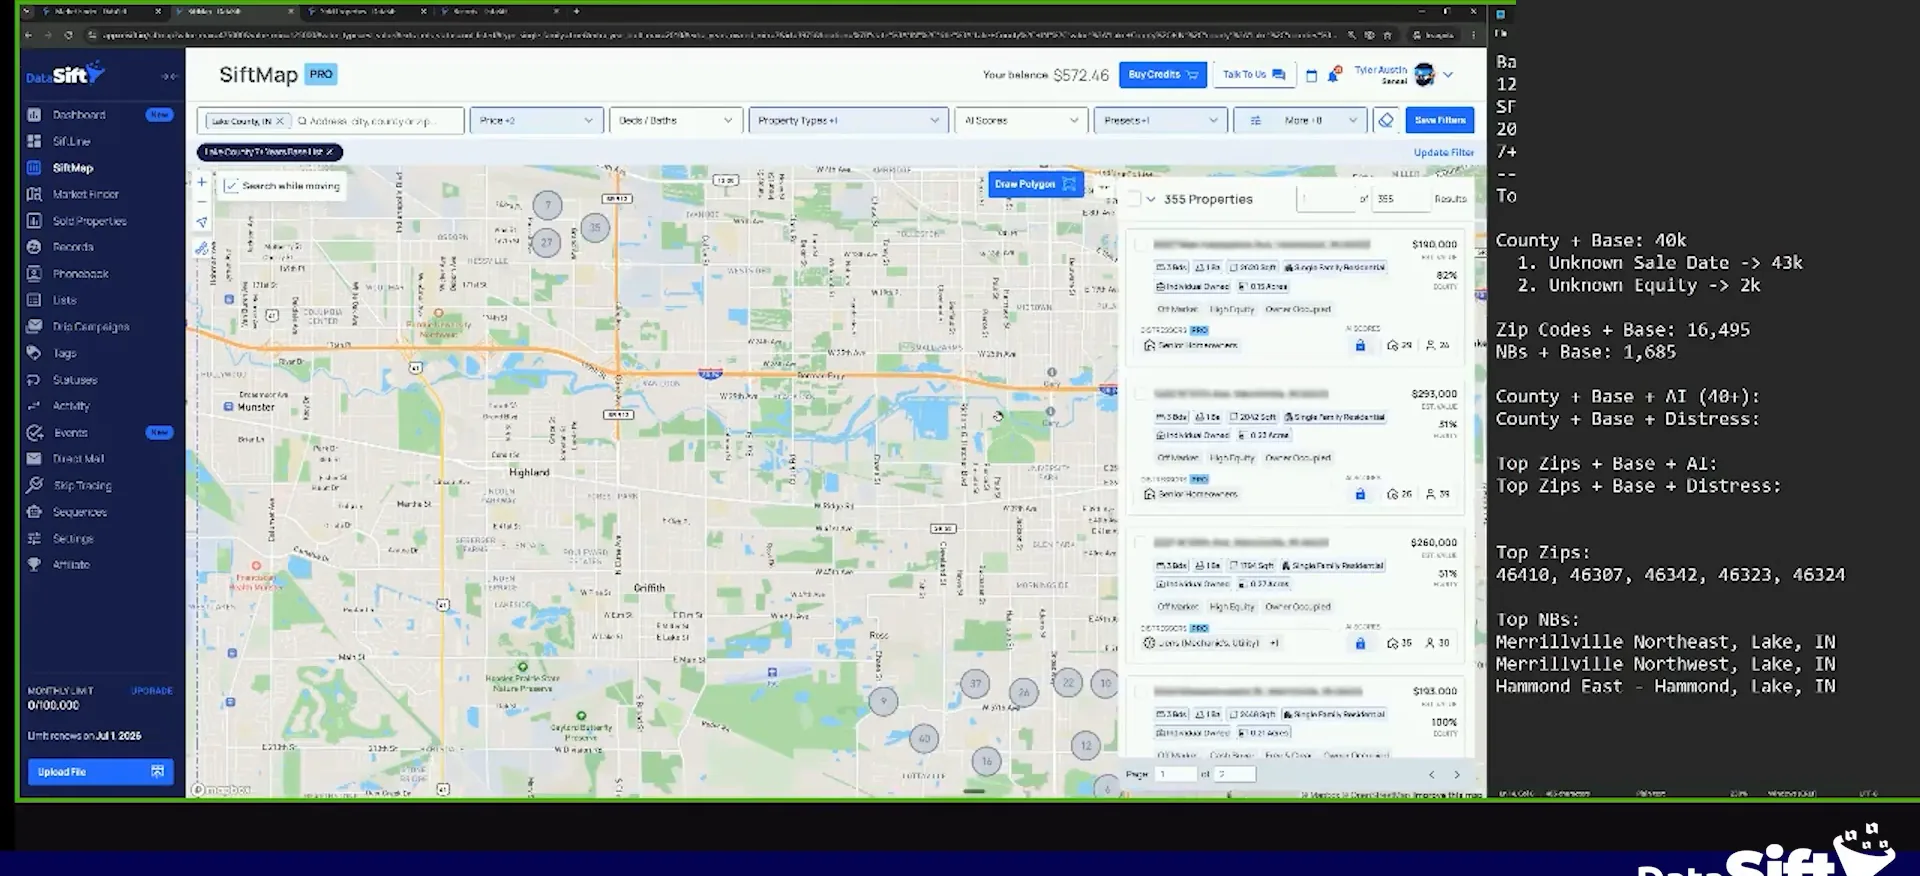
Remove the ZIP codes, stay filtered by the county, and add the neighborhoods instead. In this county that was Merrill Northwest, Merrill Northeast, and East.
Then look at how many records exist in just those areas. The whole county sits at 16,000 properties, and the three neighborhoods bring that way down. I could definitely add a handful more neighborhoods from there.
And so I could definitely add a handful more of neighborhoods, but what again, now we see we can go down from 16,000.
Top three neighborhoods
Our top neighborhoods are now at 1,600.
Mail the top three every month.
Spend $700 a month on mail to three neighborhoods.
Mail those three neighborhoods every month and you are at 12,000 a year in mail. To say I would not get a deal out of that area would be very, very slim.
You definitely have a return on your investment in those top neighborhoods. That is why I am so bullish on neighborhoods.
Add distress filters inside the neighborhoods.
Direct mail is not the only reason I like this. Now I can add distressors on top of the neighborhood.
I checked obituaries in that area out of curiosity. Not very many. Seven years of ownership, very few, so either they already sold or we do not meet the criteria. I would not add that one.
Senior owners came back 355. That is a pretty good percentage. Then I scrolled up, added absentee on top of the seniors, and clicked apply.
Split the neighborhood into three levels of effort.
Now I can say door knock the absentee ones, send direct mail to the senior owners, and cold call all 1,600. Same neighborhood, three different levels of effort.
That is the big piece I want people doing. Go into these different neighborhoods, pluck out the opportunity, and build a farm you can work.
So even within the neighborhood, I could then start breaking down the 1,600 people in a neighborhood to a prioritization of effort.
Prioritization of effort
Direct mail all seniors, then cold call 1,600.
BEFORE YOU MOVE ON