
PART 1
Set up the market finder skill.
This lesson uses the cloud skills you downloaded earlier, so grab those first if you skipped them. Then you tell Claude what you want in plain words, and it runs the market research for your county. Here is the setup and the exact ask.
Two ways to run this.
Download the cloud skills before you start this lesson.
If you have not set up any of the cloud automations or cloud skills, go back to that lesson. Download all that stuff. You are going to need it for this one. There is no way around that part.
There are two different ways you can look at this process. If you have access to the API and you are in the deal room, you can pull it in that way. Depending on when you are watching this recording, it may be live for everyone.
If you do not have it, all good. The skill will log in to Sift on your behalf and execute on all that market analysis. It uses the Google Chrome browser extension that Claude has, and it still gets you to the same place.
You just may use a little bit more tokens or just maybe a little bit more clunky, but it'll still get the job done.
Say what you want done.
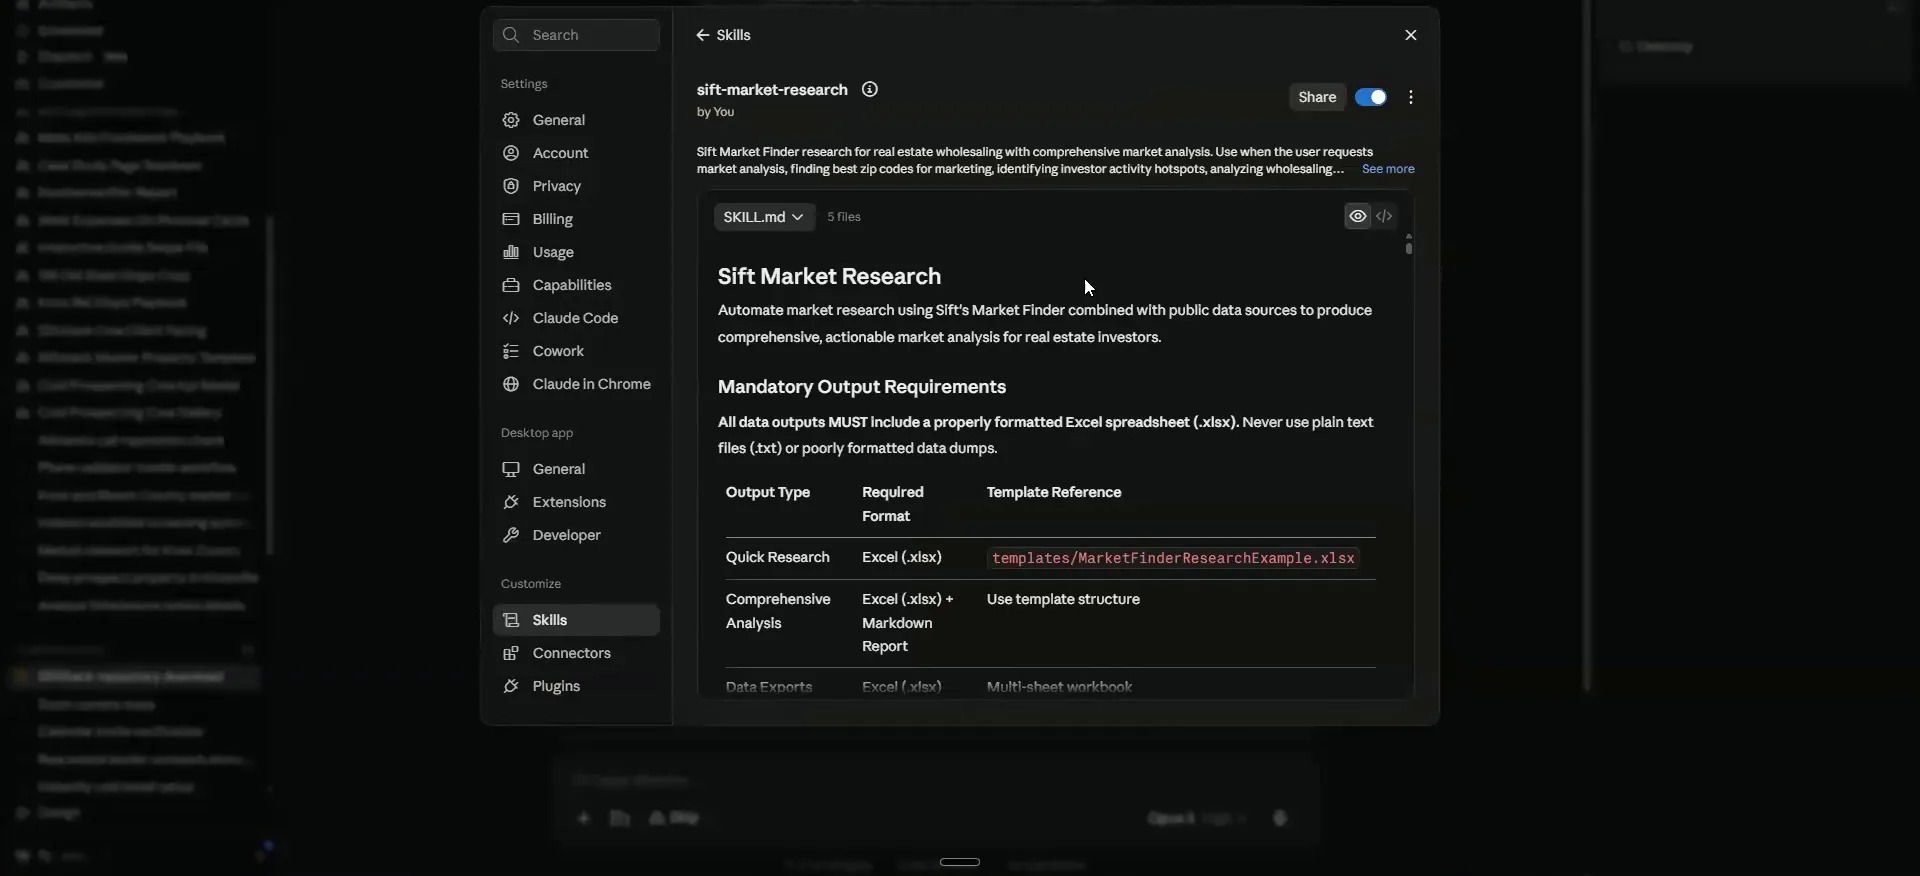
Hit customize, then open skills, and find Sift market research.
Make sure you all saw how I got there. I hit customize, and then underneath customize down there it says skills. That screen shows you every skill loaded into my Claude account.
I have so many now that I have to read through them just to make sure. The one you want says Sift market research. That is how you know it is set up correctly.
Ask for every ZIP code and every neighborhood.
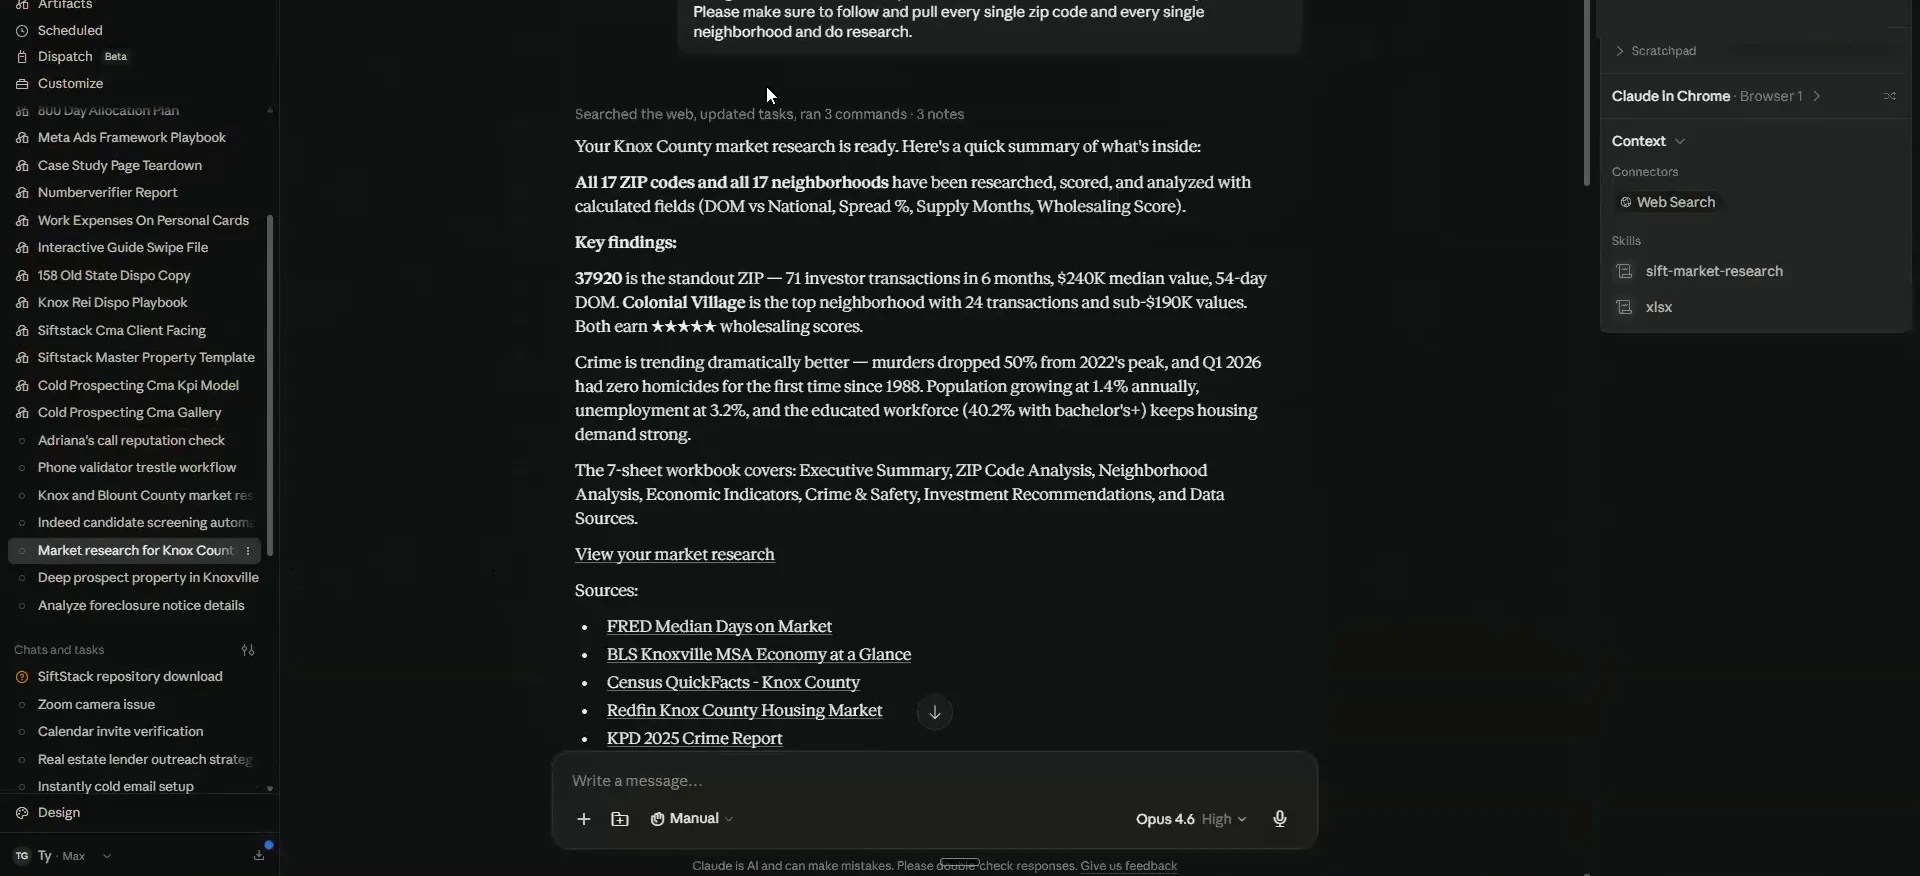
You do not have to do anything besides say what you are trying to get done. I came up to the top and said, using the market finder skill, please do market research for Knox County, Tennessee. Then I said please pull every single ZIP code and every neighborhood and do all the research possible.
This one I ran before so you could see it. It logs in on your behalf straight into DataSift. If you are in the deal room, it uses our API to make those calls to all the tooling it needs.
Say it verbatim
You do not have to do anything besides just say verbatim what you are trying to get done. Ask for every single ZIP code and every neighborhood.
Grab the prompt from under the market finder workflow.
The output is a ton of analysis that it pulls in through Sift. It also does its own research on things like what the crime data looks like here, or what the economic data looks like here. All those different pieces go into market analysis.
I copy the prompt in here too so you can see it. Everything I am talking about, and what you need to run it, sits in one place.
But everything that I'm talking about right now and, to actually execute on that is going to be, right underneath the market finder workflow.
BEFORE YOU MOVE ON
PART 2
Run the skill, then suppress.
The skill gives you the report. The Market Finder page is where that data actually comes from, and you can change it fast. Then I show you what I do with it, which is remove the areas I do not want instead of picking favorites.
The market finder workflow.
Click the skill and sign in to Sift.
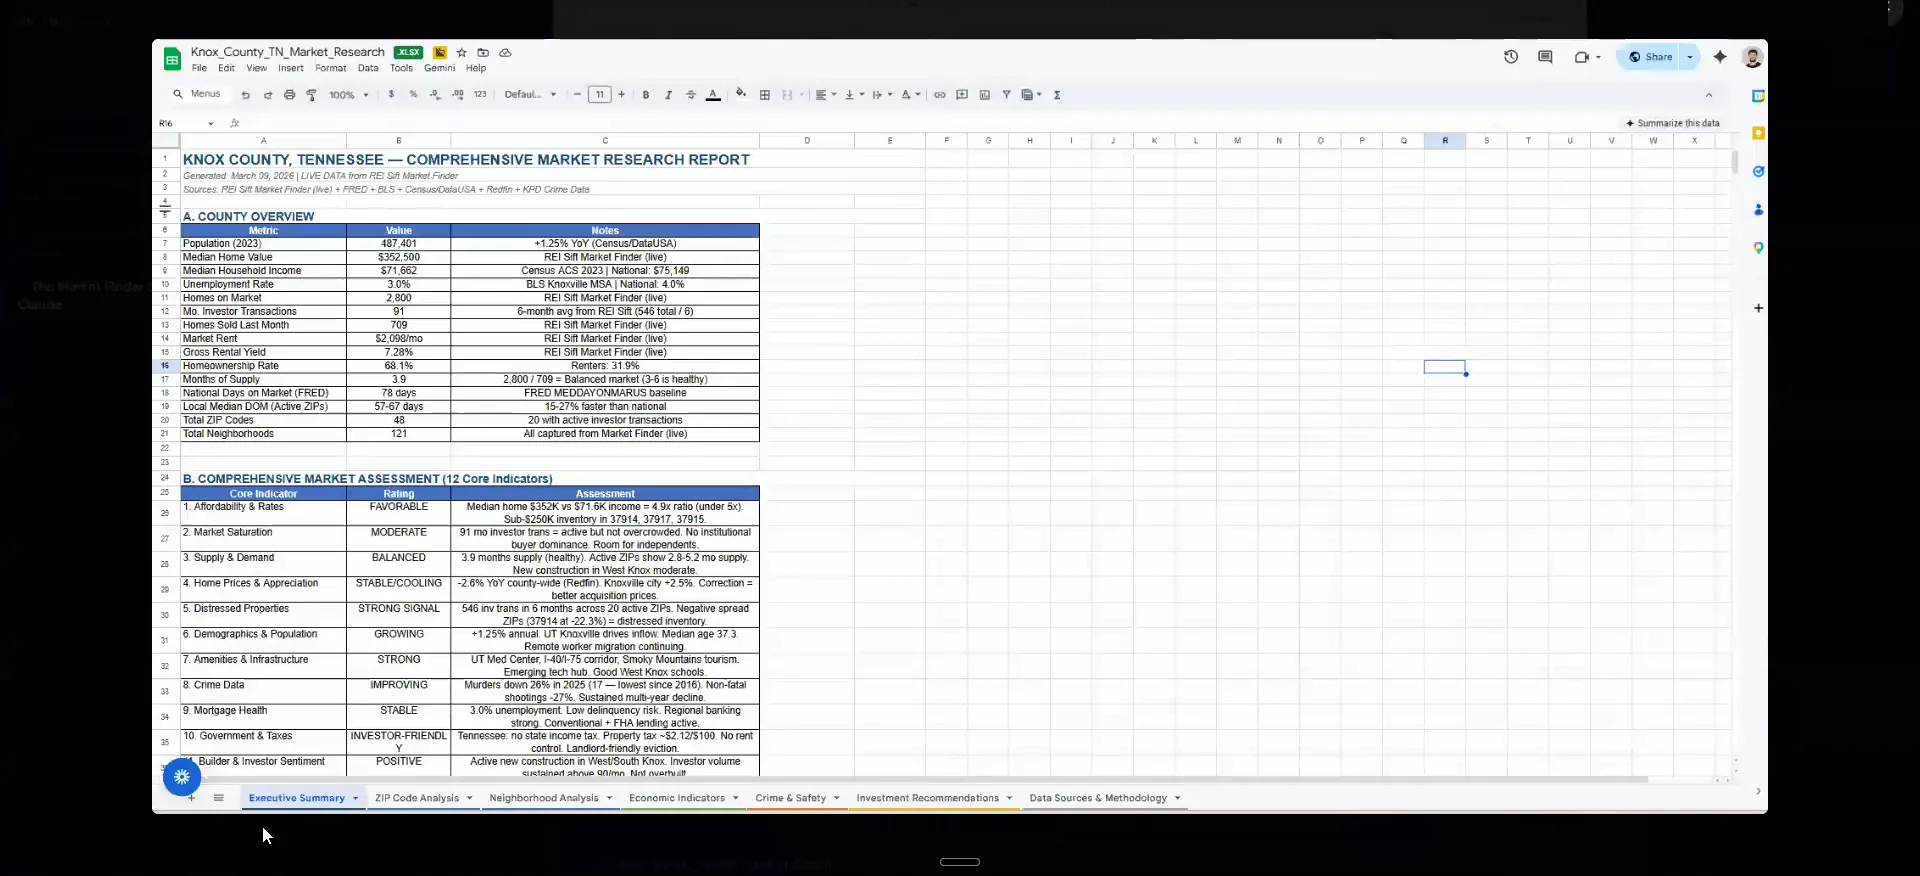
If you do not want to copy in that link, click on it and the individual skill is right there. Scroll down and you see what it physically looks like. If you have never done this before, it will also ask you for your login credentials for Sift.
What it produces is a full summary of everything going on in the market. You get a ZIP code analysis, a neighborhood analysis, and all those economic indicators and crime stuff I mentioned.
And if you are trying to use the API through the deal room, you'll have to give your API key directly to, to Claude.
Open Market Finder and pick your state and county.
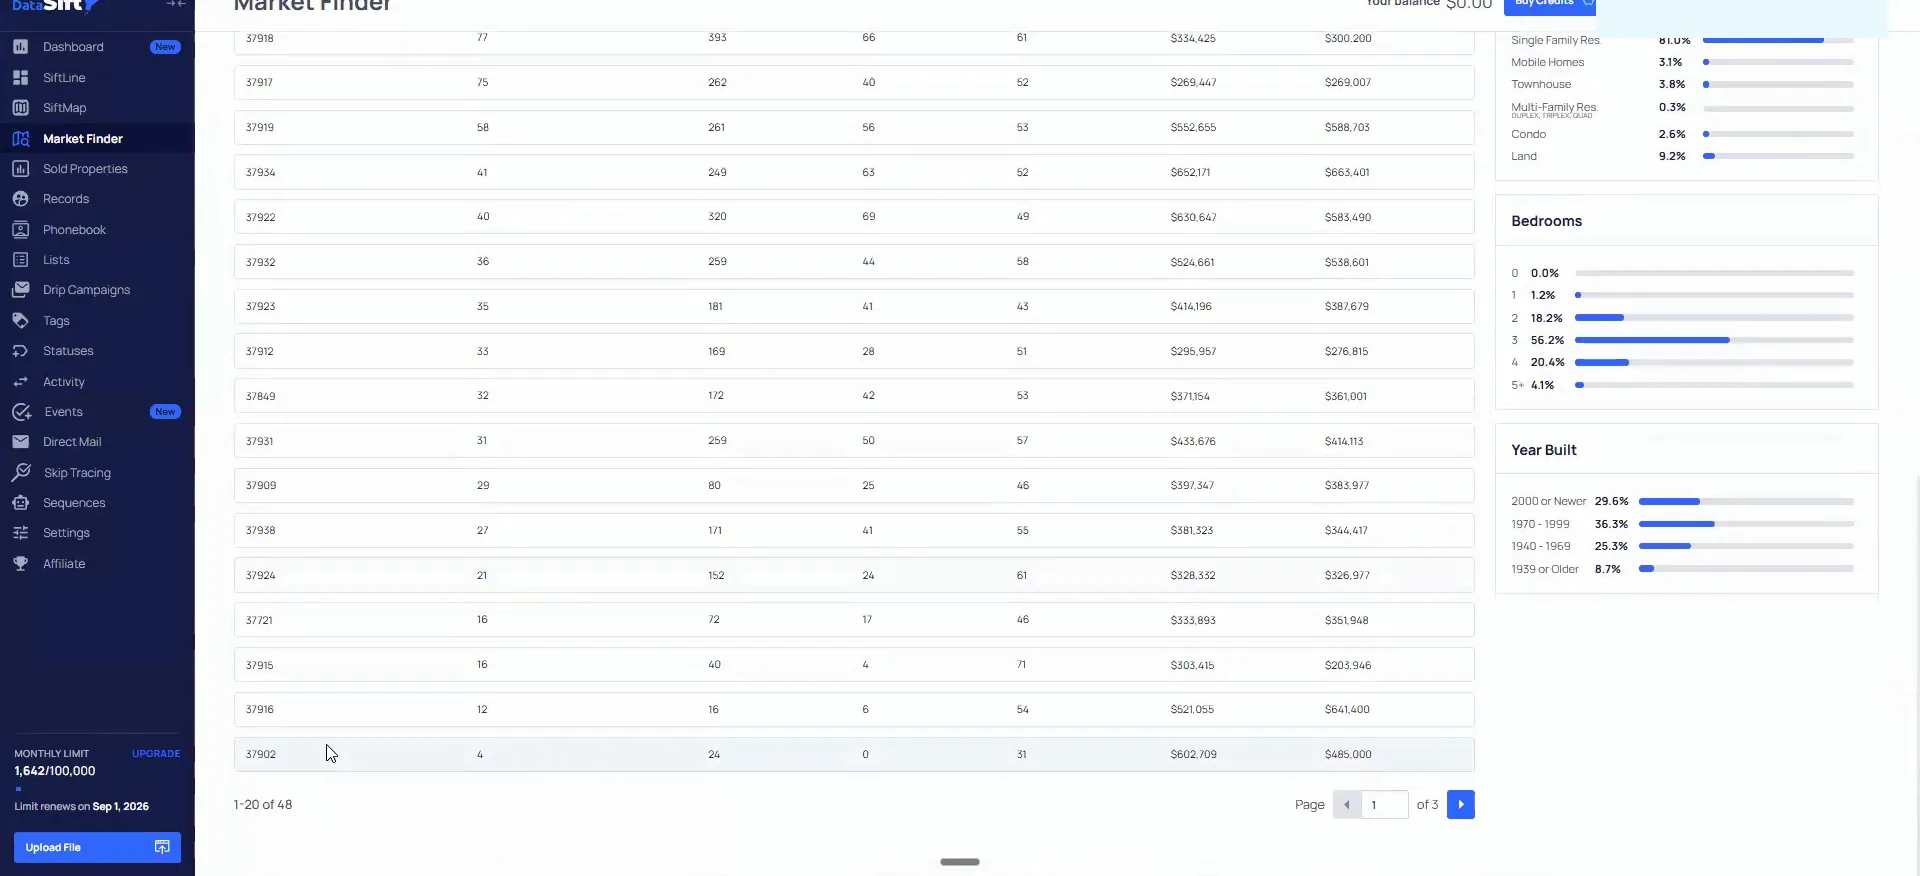
When you come into the actual Sift page under market finder, this is where all of that data is actually coming from. It is very similar to how it shows sold properties. Doors per deal is just a more advanced way to look at it, and we can change it super fast.
I go to Tennessee, then into Knox County. This is what it looks like on the ZIP code level. It sorts from greatest to least, so 37920 has the most investor transactions by far. Some of the ones down the list have only had four in the last six months.
And what it's doing is it's showing me at a ZIP code level from greatest to least the most amount of investor transactions from top to bottom.
ZIP code level
Knox County ZIPs rank from greatest to least.
Investor transactions over the last six months. 37920 has the most by far.
I suppress what I do not want.
Remove the neighborhoods and ZIPs you do not want.
There are a lot of ways to use all this analysis. The way I like to do it is on the record side, which is where we manage our marketing campaigns. My hottest records come from my priority one on the doors per deal. In Knox County that is free and clear, senior homeowner, vacant, and my AI score of 95 plus.
This is very specifically how I use all that neighborhood analysis and all that ZIP code analysis you are running in Claude. I remove all the neighborhoods I do not want to be in. I am going to say that one more time. I suppress at the neighborhood or the ZIP code level instead of shortlisting the best areas.
And I've just found that it's easier to suppress things as opposed to, shortlist, the top 10 ZIP codes and stuff like that.
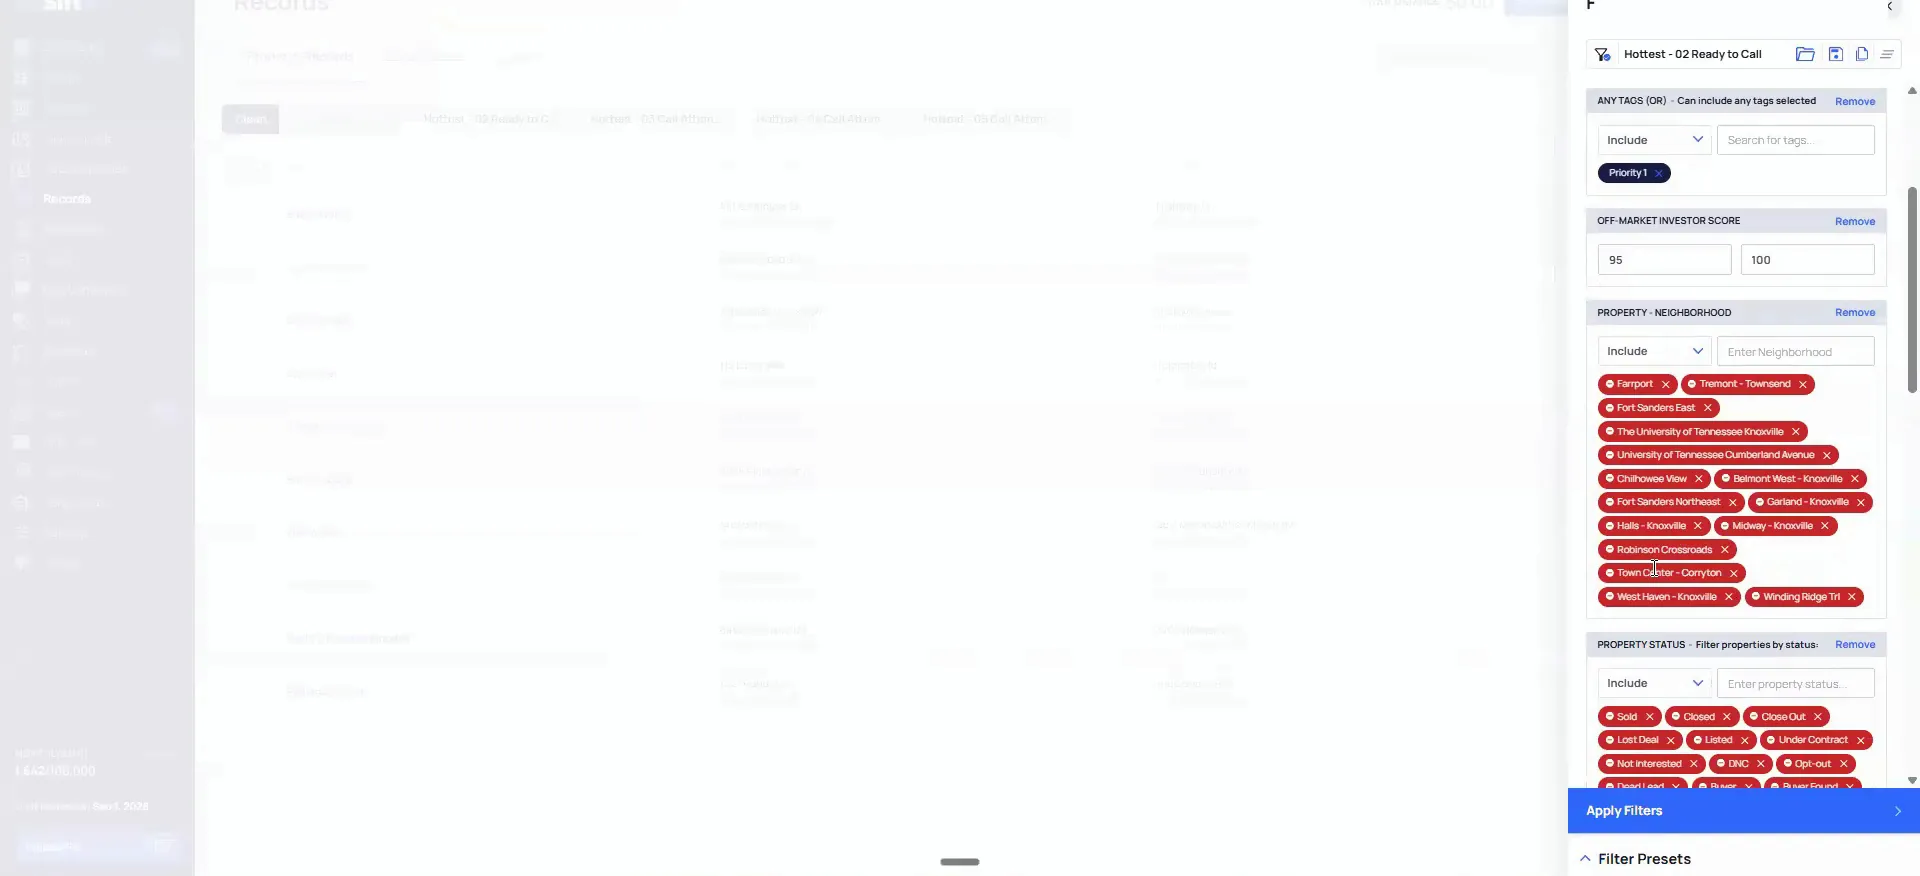
Suppress low equity and negative equity as well.
I do the same thing with equity, and we talk about this more tomorrow. I suppress low equity and negative equity. That way I capture the high equity stuff, the free and clear stuff, and I also capture the unknowns.
It is just easier. I do not like this stuff, so I remove it. Then I set the rest of my box from there.
And then I also only do single family homes, and I do a 100 k to 700 k buy box on my price range.
BEFORE YOU MOVE ON