
PART 1
Count your records at every level.
This is how I break a market down, and it is how I have done it in my own real estate business since day one. County, base criteria, ZIP codes, neighborhoods, and then I look at how many records exist in each one. Your budget and your channels decide what you do with those counts.
County, ZIP codes, neighborhoods.
Break your market down from county to ZIP codes to neighborhoods.
I like to start at a high level and work down. County, the base criteria, ZIP codes, neighborhoods. Then I take predictive AI data and distressors and look at how many records exist in each of these.
That order is the whole framework. Everything after this is just filling in the counts.
Filter by county on SIFMAP if you want it simple.
I want to make it clear that you do not have to do the fancy stuff. You can go to SIFMAP, filter by your county, and download the standard list that everybody pulls. Absentee, high equity in my county, download it, and market to it.
It is not that it would not work. It is that you are going to spend more money, time and energy.
It's clear that if you don't wanna do this fancy stuff, you could just literally go to SIFMAP, and you could filter by your county.
Open a notepad and write your three bullets.
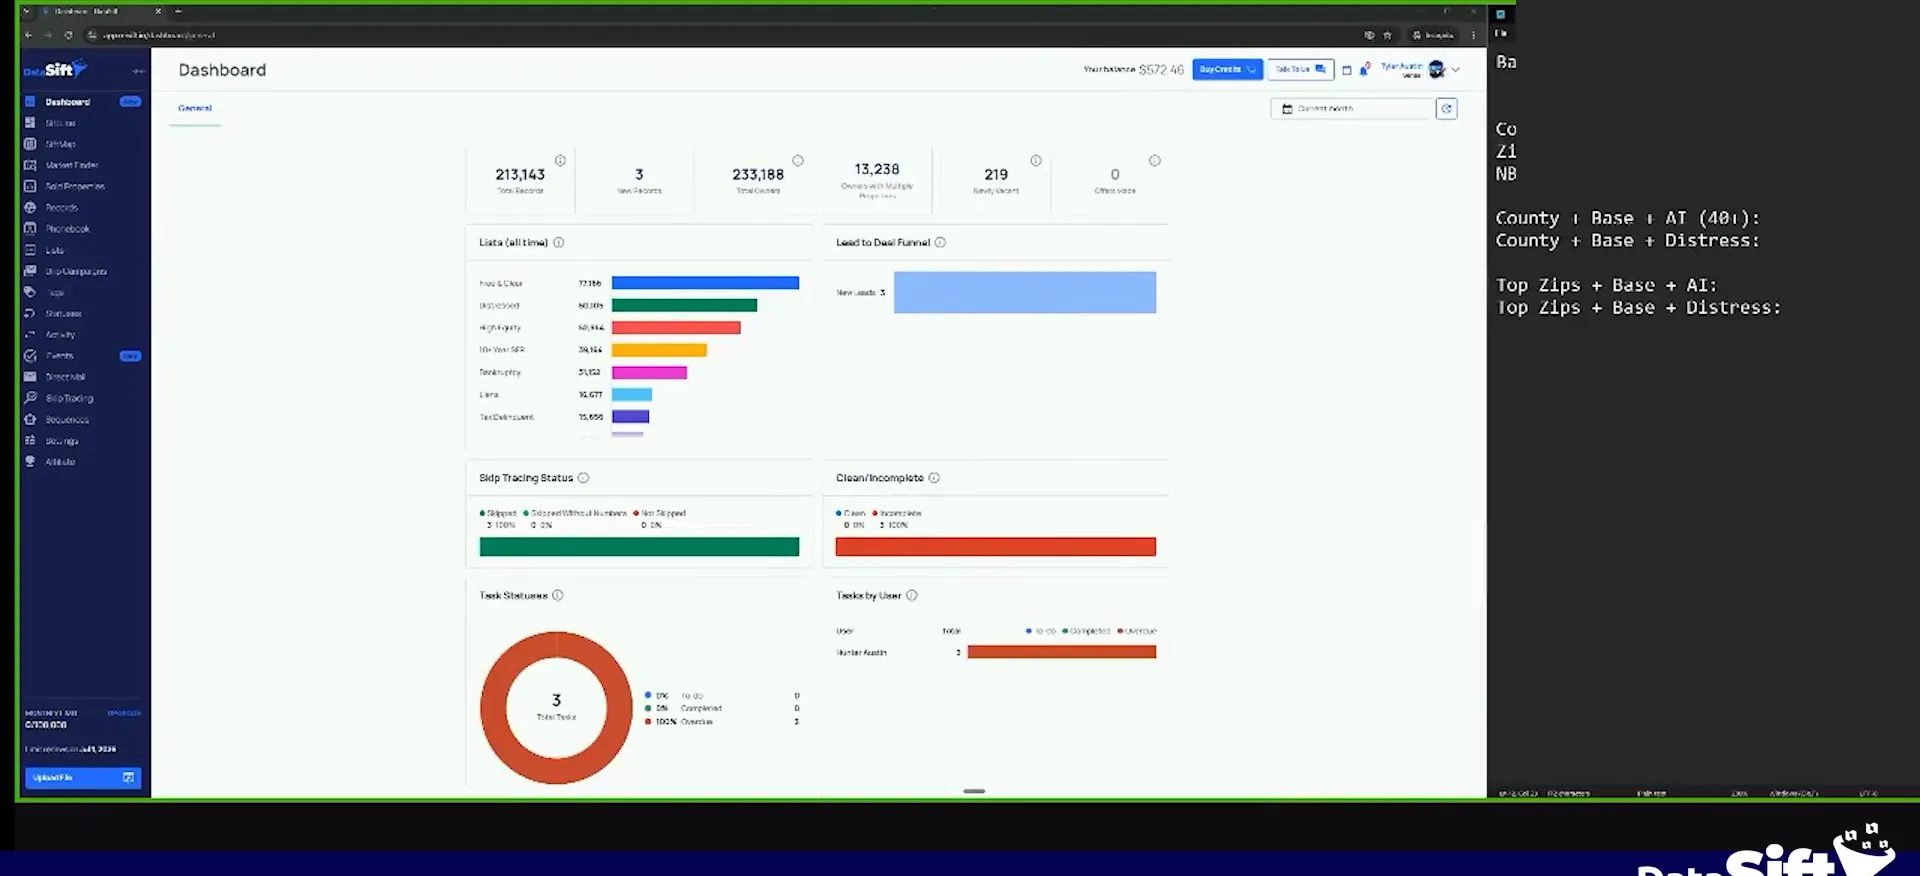
I open up a standard notepad. You can use pen and paper. I write base criteria, then county plus base, then ZIP codes plus base, then n b's plus base. The n b's stands for neighborhoods.
A base criteria is, like, the standard characteristics. I will show you how to come up with yours. Right now I am just creating some bullet points.
Then I fill in the counts. Maybe there is a 100 k at the county level. Maybe at the ZIP code level there is only 30 k or 35 k. Maybe there is only five k at the neighborhood level.
My budget and the amount of marketing strategies I am doing change what I do next. I might send mail to all my neighborhoods and cold call all my ZIP codes. Then I take the base criteria and run Facebook ads with it. With deep understanding comes the ability to manipulate, and that is one of my Tylerisms.
I just wanna know how many records exist inside of my county, my ZIP codes, and my neighborhoods with my base criteria.
Record counts
How many records exist at each level.
Base criteria plus AI score.
Add a 40 plus AI score to the same county.
Work to have the deep understanding about it. That is what lets us take $1 and put it out to the marketplace and get $10 back.
Once I know how many records exist in the base criteria in just the geography, I add AI score to the equation. I write base plus AI. I want to see what 40 plus AI scores do in that same county, same base criteria. Does it go from 100,000 records down to, say, 40,000 records?
If it does, and the AI score has good predictability in that county, then I can save 60% of my marketing costs. I cold call 40,000 people instead of 100,000 people and still get in front of 80% of the people that would sell. The economies of scale work really well in my favor.
Base plus AI
A 40 plus AI score saves marketing costs.
Try a single distressor when you are not using AI.
For those that are not on AI, you can do base county plus a single distressor, or something like this. Dig into it, because every county is different. So you run your county at a base level plus your distressor.
And then what you could do is for those that aren't AI, you could do base county plus a single distresser, right, or something like this.
Do not market to the whole county unless first to market.
Once we get into market finder and look at where the opportunity is, things change. You pretty much never want to do all of your county. Unless you are doing first to market marketing, I do not care about the county.
I would say 60% of any county is places you do not want to spend money getting in front of. The turnover is not there to build a consistent business. You might get one every now and again.
You do not want to take 30% of your marketing budget and put it in areas you will not get revenue from. Take that same 30% and divert it into another channel, in an area of that county that will yield a better return.
And so most of the time, I would highly recommend being top ZIP codes, top Zips plus your base plus AI or some other form of distressor.
Top ZIP codes plus base criteria.
Keep your base criteria on every record you pull.
So it is top ZIP codes plus your base criteria. You never want to get rid of your base criteria. Your base criteria is kind of like your golden metric.
Sometimes you can expand on it. It stays core to every single record you pull in your business.
Sometimes you can expand upon your base criteria, but it's really pretty core to every single record that you pull in your business.
Base criteria
You never wanna get rid of your base criteria. Sometimes you can expand upon it, but it is pretty core to every single record that you pull in your business.
Figure out your total marketable audience before you spend.
The important thing is to see clearly how many marketable records exist inside the county in these different areas. Then watch how that changes as we add more farm criteria to the parameter.
Here is another way to explain it. If I were buying a piece of land to build a McDonald's on, I would not just put it on a random corner. McDonald's would not let me. I would have to figure out how many people drive past that location.
What is the avatar of the people driving past it? I would have to figure out my demographics and total marketable individuals. That would determine, on average, how much traffic would pull through the drive-through and buy. We do the same thing as real estate investors, and now we start filtering to see how many records exist inside Lake County, Indiana.
BEFORE YOU MOVE ON