
PART 1
Tracking KPIs with Claude.
KPIs get romanticized, and really they are just numbers on a spreadsheet. This Part shows how I pull a custom KPI report with Claude, and what the workbook it builds actually contains. Then we read one closer's month and work out how many leads a deal really takes.
Numbers you can make decisions from.
Turn your KPIs into decisions that improve the business.
Tracking KPIs with Claude is one of the coolest use cases I have seen. You use AI to find insights you would never find on your own. A lot of the time people romanticize KPIs, and it really is just numbers on a spreadsheet.
This teaches you how to take those KPIs and make useful decisions out of them. You either improve the business or you double down on something that is already working.
You will need the API for the best results. You can also do it through the Google Chrome browser extension and approach it that way.
And this is the entire process to do that.
What the KPI side can do now.
Open the challenge hub and start with KPI tracking.
We are on the scaling operations day. I have it all pulled up from where I ran it this morning, so we start with KPI tracking.
We used to have a very large road map for building out a ton of really nice KPI dashboards inside of SIFT. All these indicators were on it. Then we found what Claude can do with the API, for the real estate side, the data side, and our own internal businesses.
You can pull KPIs that are custom each time. You ask for a custom report, it uses the tooling from the API, and you can use what it finds to look for correlations.
So an example of how I think this could be used is, one, you can obviously pull KPIs that are custom each time.
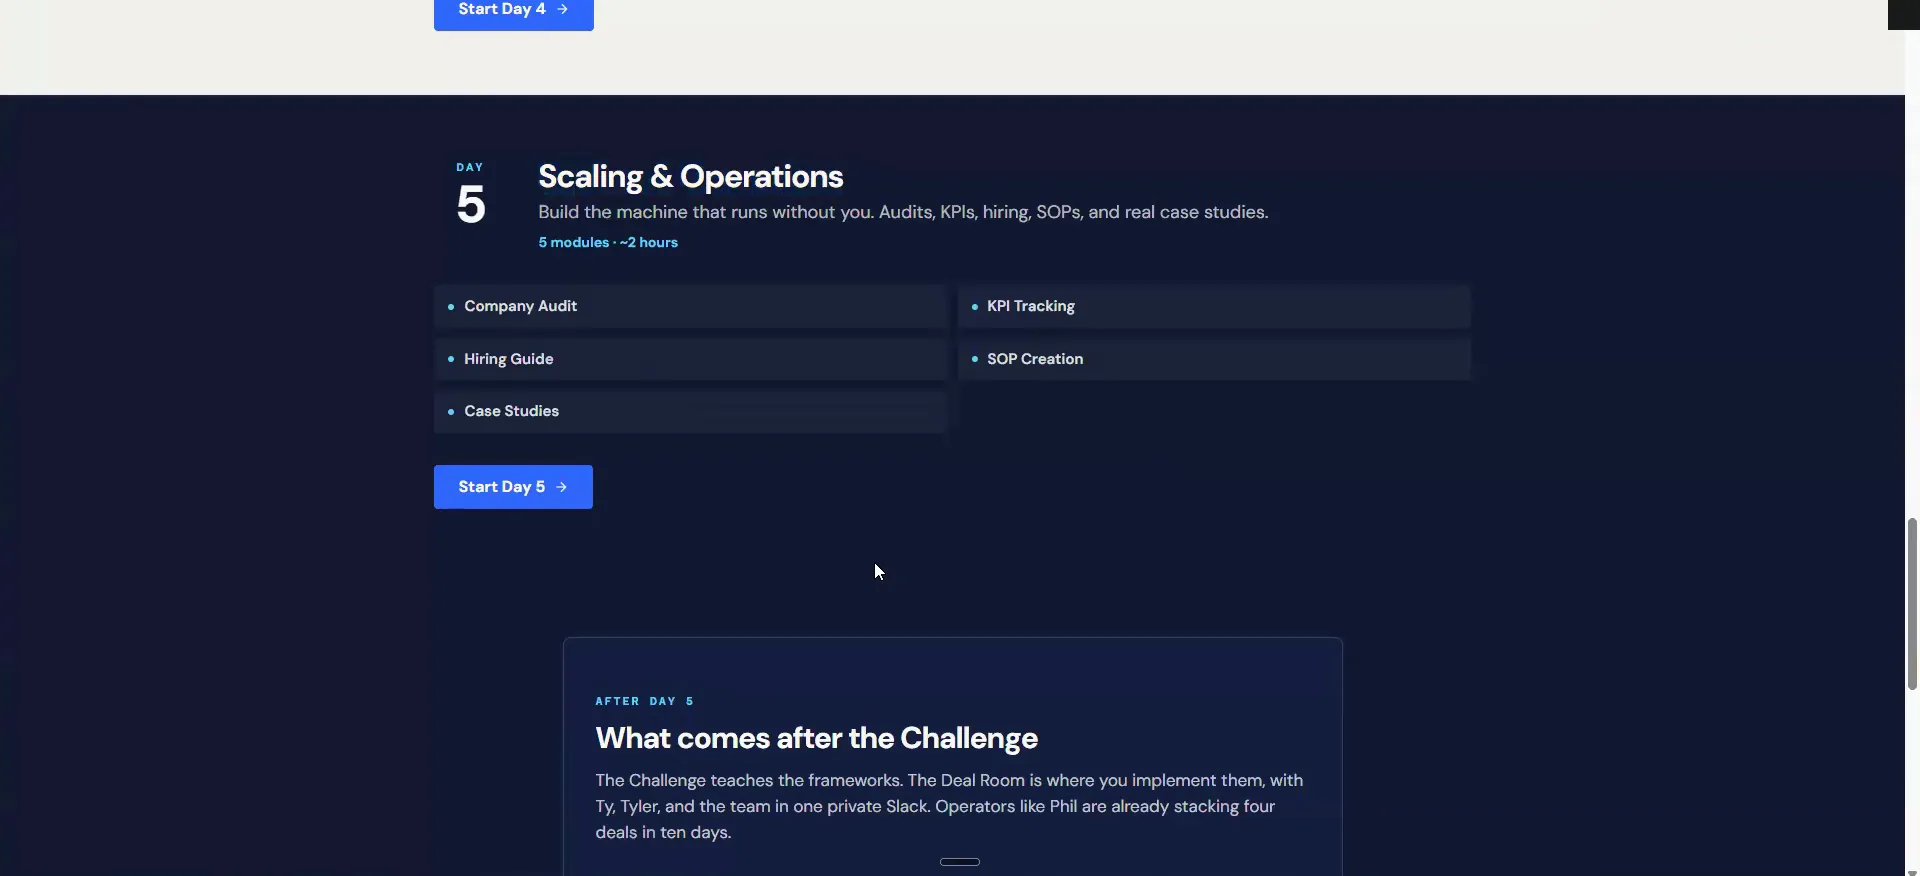
Ask Claude for a full breakdown of one person's KPIs.
This is my stack. I said, hey, can you do a full breakdown on this person's KPIs, and here are the three contracts that they got. That helps it locate that this person was assigned to her.
I did it that way because when we push properties into the lead management and closing side, they change ownership. Giving it the contracts by address is more stable. You can just say these were the three contracts last month that came from this individual.
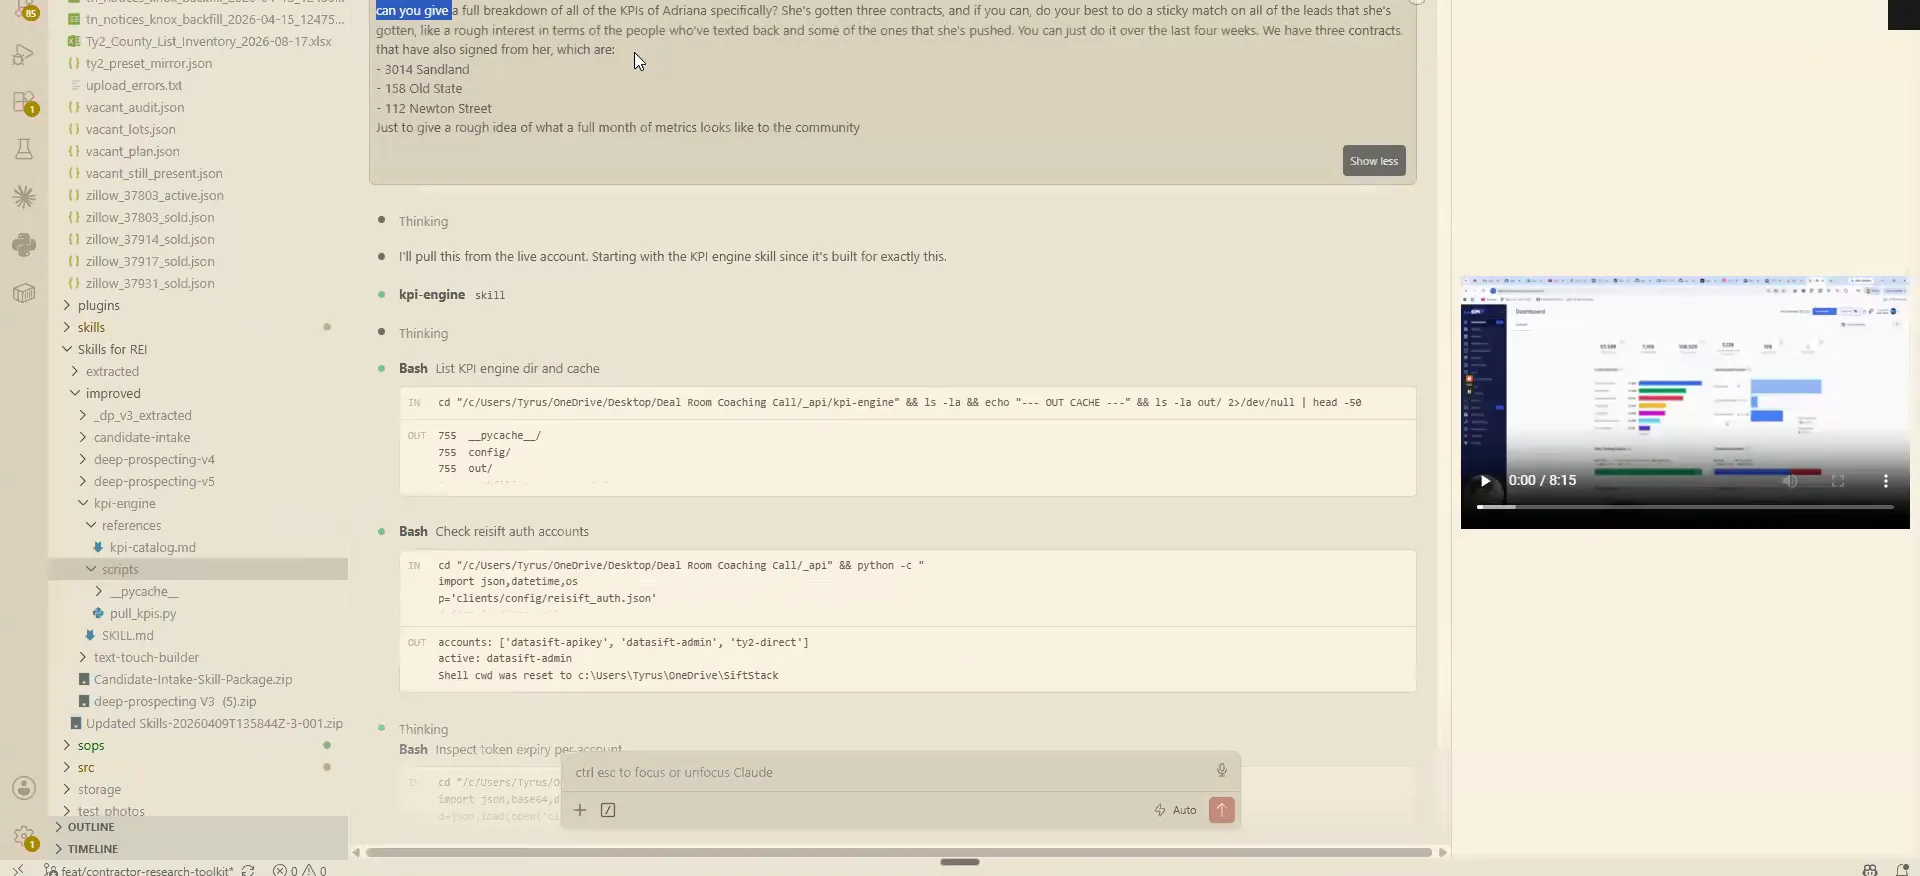
Scroll to the bottom and open the workbook it built.
At the bottom it builds out the whole workbook, and the workbook is an Excel file. This was all built in ten minutes, and I walked away, all in one shot.
Inside you get the day by day KPIs and the week by week view. How many dials, dials per day, answered conversations, dials confirmed through the smartphone, the text confirmations that went out.
It also carries the unique records that went out with a text sent, talk time, and every response from all of the messages. Then it gives you an idea of how many records fit into each of these categories.
And this workbook is an Excel file that I'll kinda run you guys through, but this is what the KPIs side is kinda possible with now.
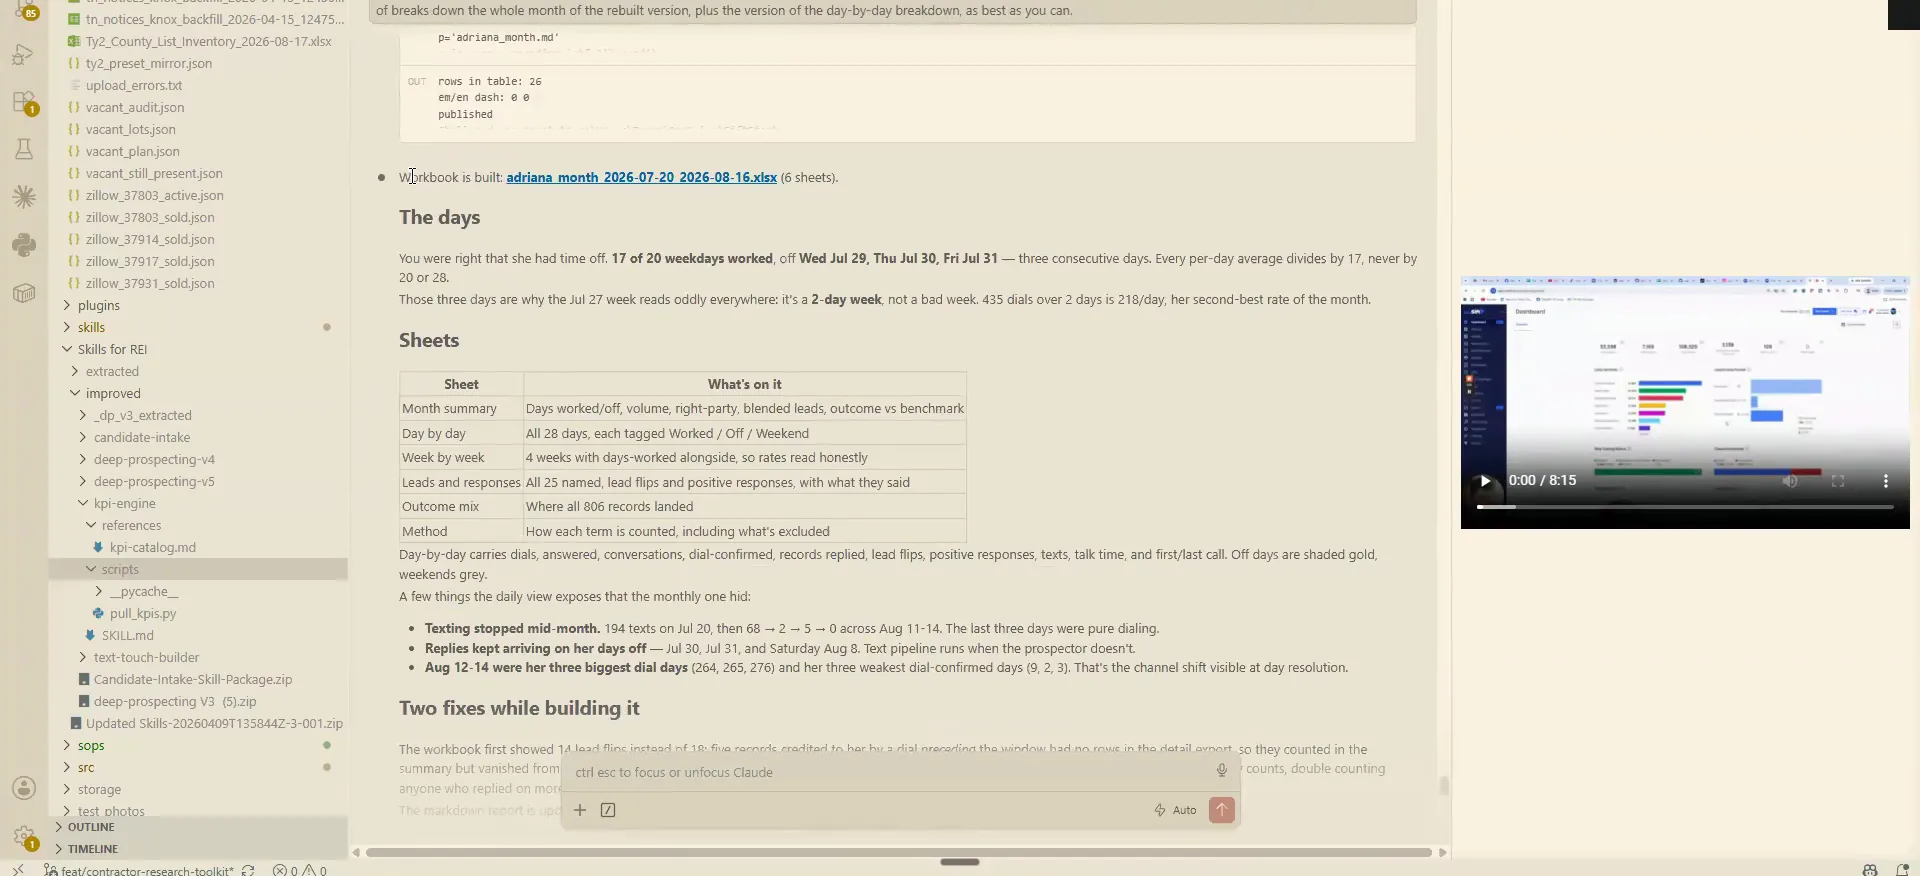
The amount of records in each category.
Read the dials, answers and text replies day by day.
She generated 193 worked properties on the noninterested side. Remember that 20% of those end up becoming all of our deal volume down the road.
She had some days off, and there are weekends in there. It still breaks down dials per day, and the people who answered conversations above sixty seconds. Those are typically the follow ups and tasks she sets for herself.
You also get records that replied on the texting side, positive responses, and texts that were sent. This was before we had all the automations going, so those are texts she sent out manually herself.
One caller, one month
What one caller worked in a month.
The old bulk numbers were 50 to a 100 leads per deal. These came from our highest doors per deal.
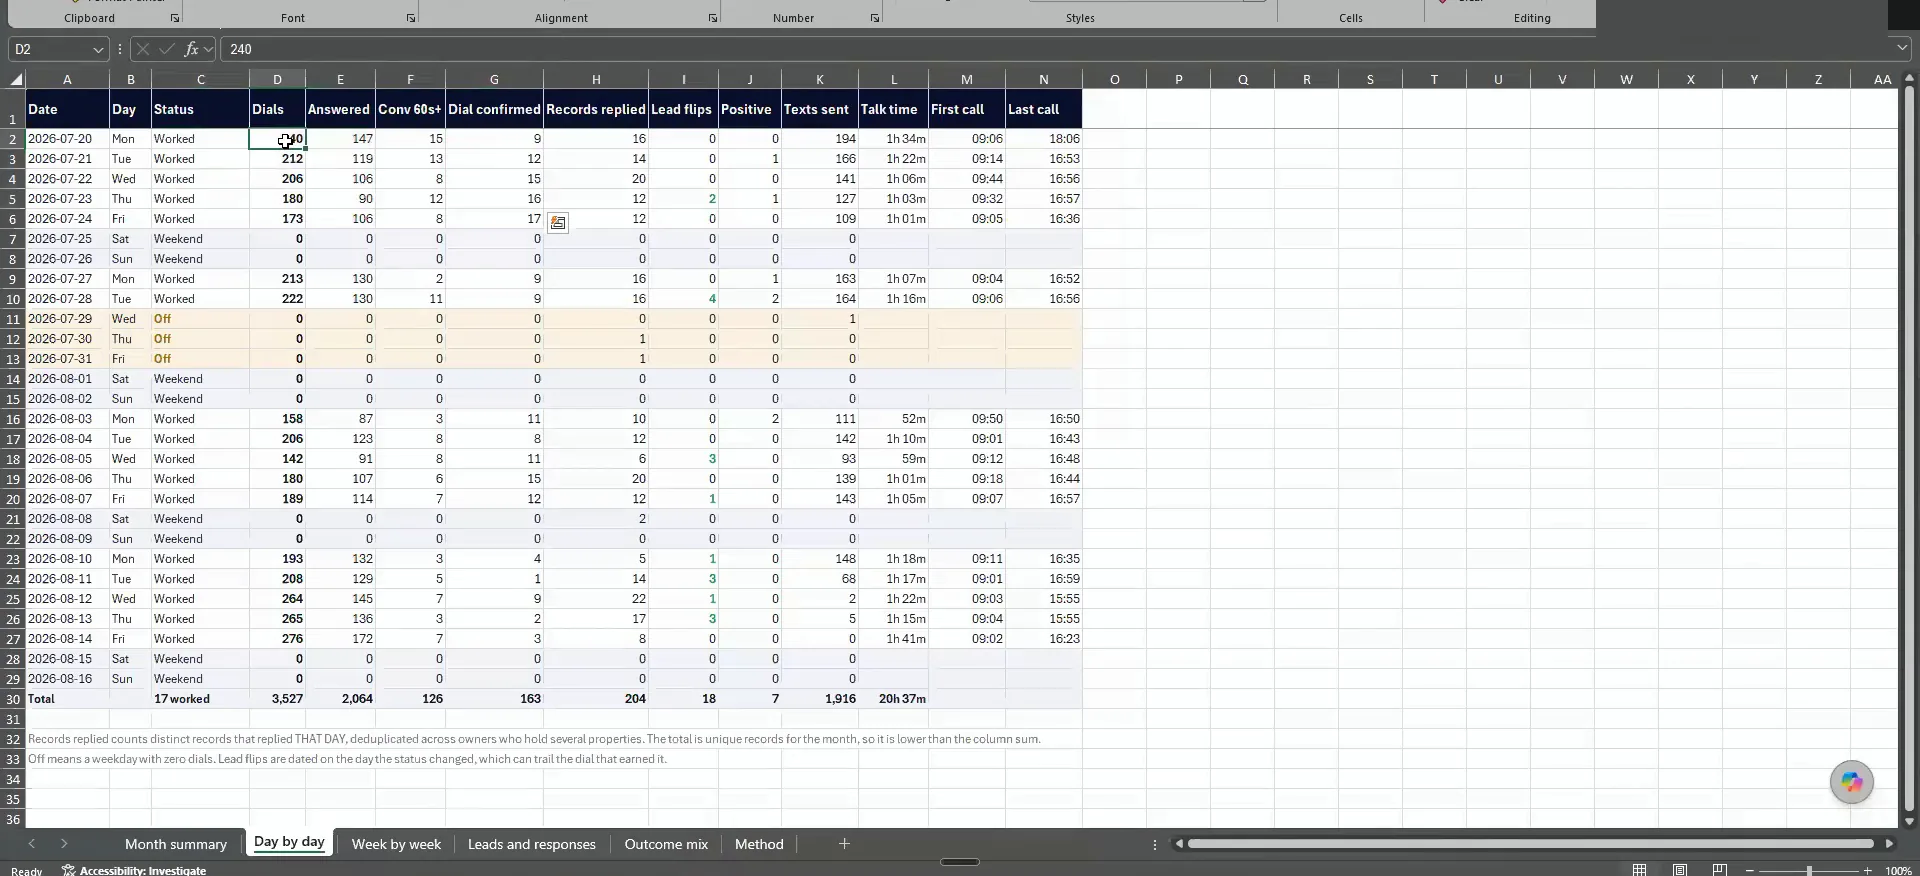
Count how many leads it actually took to contract.
It all came down to about 28 leads in her nineteen working days, and that equated to three contracts. I wanted to point that out because it all came from our highest doors per deal.
Whenever you are doing the doors per deal framework, I used to think it was somewhere between twenty and thirty leads for a deal. Now I think it is much lower, and the people you get to have the conversation with are much higher quality.
That is because we cascade the filtering through the SMS flows. We also connect it on the conversations when we do the outbound dials and voice mails. We add an insane amount of friction on the front end. Anyone who still wants a conversation after that is a really good opportunity.
I actually think now it's somewhere between five and fifteen, which is much, much lower in terms of the amount of leads that you're generating.
Expect slow first touches instead of bulk lead counts.
I predict this is just how things are going to be going, as opposed to getting 50 to a 100 leads per deal. That was how it used to be whenever bulk was super prominent.
Phil added that you get a high follow up rate on these things to begin with. What we are finding is that almost everybody who starts will say this does not work in the first five days. It actually does not.
To add on to that too just a little bit, you also get a high f u rate on these things to begin with.
BEFORE YOU MOVE ON
PART 2
KPIs you actually act on.
Pulling the numbers is the easy half. The part that matters is what you change the same day, whether that is killing a bad list or sizing a caller's week. This Part covers the follow through, the alerts, and how many records one person can really touch.
Don't give up after the first contact.
Size the caller list to what you touch in a day.
It is the second, the third, and the fifth contacts that are making it. So don't give up on these things and think it's just Ty is really good at it. It's not. You have to have follow through, and it has to be real quick too.
I've seen people pull a list that took them three weeks to get through their first contact. Now they start back ten days after that first attempt, and it is like starting over. If you don't touch the list every day for five days in a row, it gets stale really quick.
Find out how many records you can touch in a day, and that's how big that caller's list should be for the week.
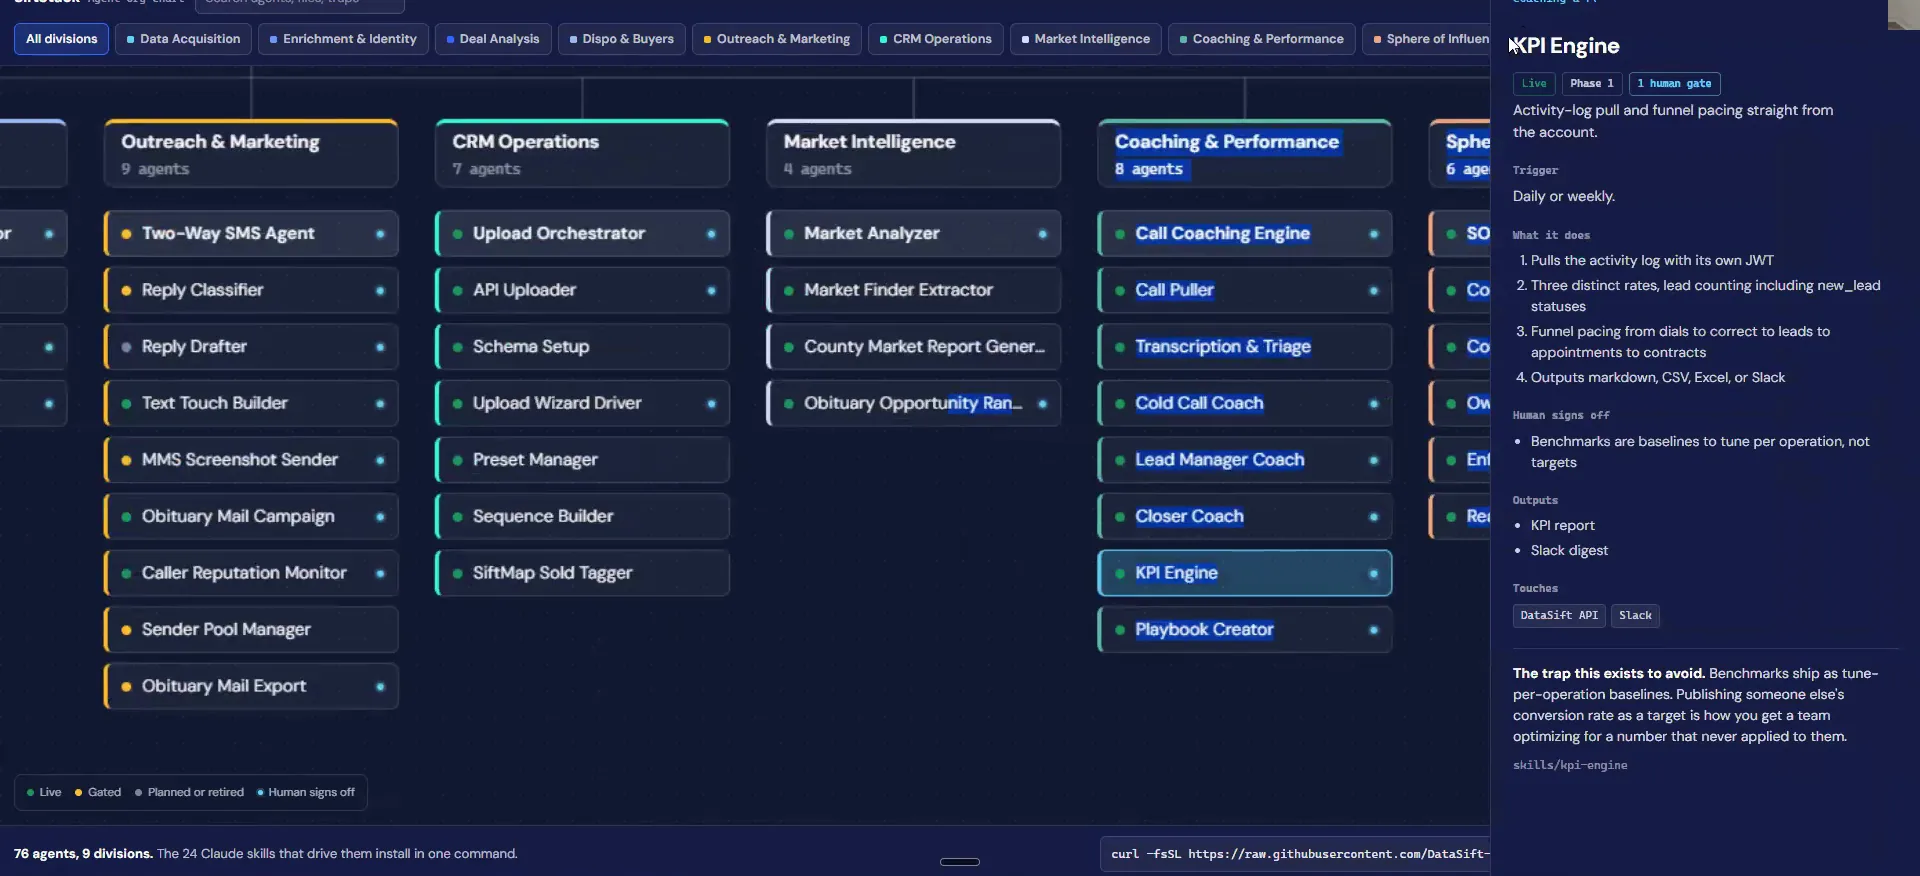
Pull your KPIs from any source with the KPI engine.
Inside the agent stack, the KPI engine lets you pull from virtually any source to generate your KPIs. That is a big, big deal, because your numbers do not all live in one place.
I didn't touch on it earlier in the call, but it sits right there in the stack with its triggers and outputs listed.
The bad day
What we did on a bad calling day.
- 1Response rates dropWe had a really bad day in one of our calling with very low response rates.
- 2Way below what it normally isClaude says this is way below what it is normally at.
- 3Slack automation firesIt sends out a Slack automation saying there is a problem.
- 4Look at the properties calledI asked it to look at the properties the team was actually calling on.
- 5Kill all those listsWe killed all those lists and put new ones in for the next day, and everything was fine again.
Act on the alert the same day it fires.
The whole point of tracking KPIs is so you can derive tangible steps, either to remedy something or to double down on what is working. Most people say they track their KPIs and then just don't do anything with it. That is the issue.
We had a really bad day in one of our calling campaigns, with very low response rates. I asked it to look at the properties the team was calling on. We had pushed in a bunch of marketing records that were outside our high doors per deal band. We killed those lists, swapped them the next day, and everything was fine again.
So Claude is incredible at being like, this is way below what it's normally at, and it sends out a Slack automation saying there's a problem.
You have to make good decisions.
Compare today's contacts to yesterday's and adjust.
With inbound you are very slow to make changes. Outbound is the opposite. You can look at one person day to day and move on it right away.
That is how we figured out we were pulling crappy lists before the automations. If you suddenly had 20% more dials in a day, you were calling a bad list or had bad data. A large amount of my success is the speed at which I move on things.
if I see somebody all of a sudden goes from 30 contacts to and it drops from day to day, you can make adjustments real easily.
Pull them, then act
You have to be able to pull them and make good decisions off of them. Double down on what is working, or kill what is not.
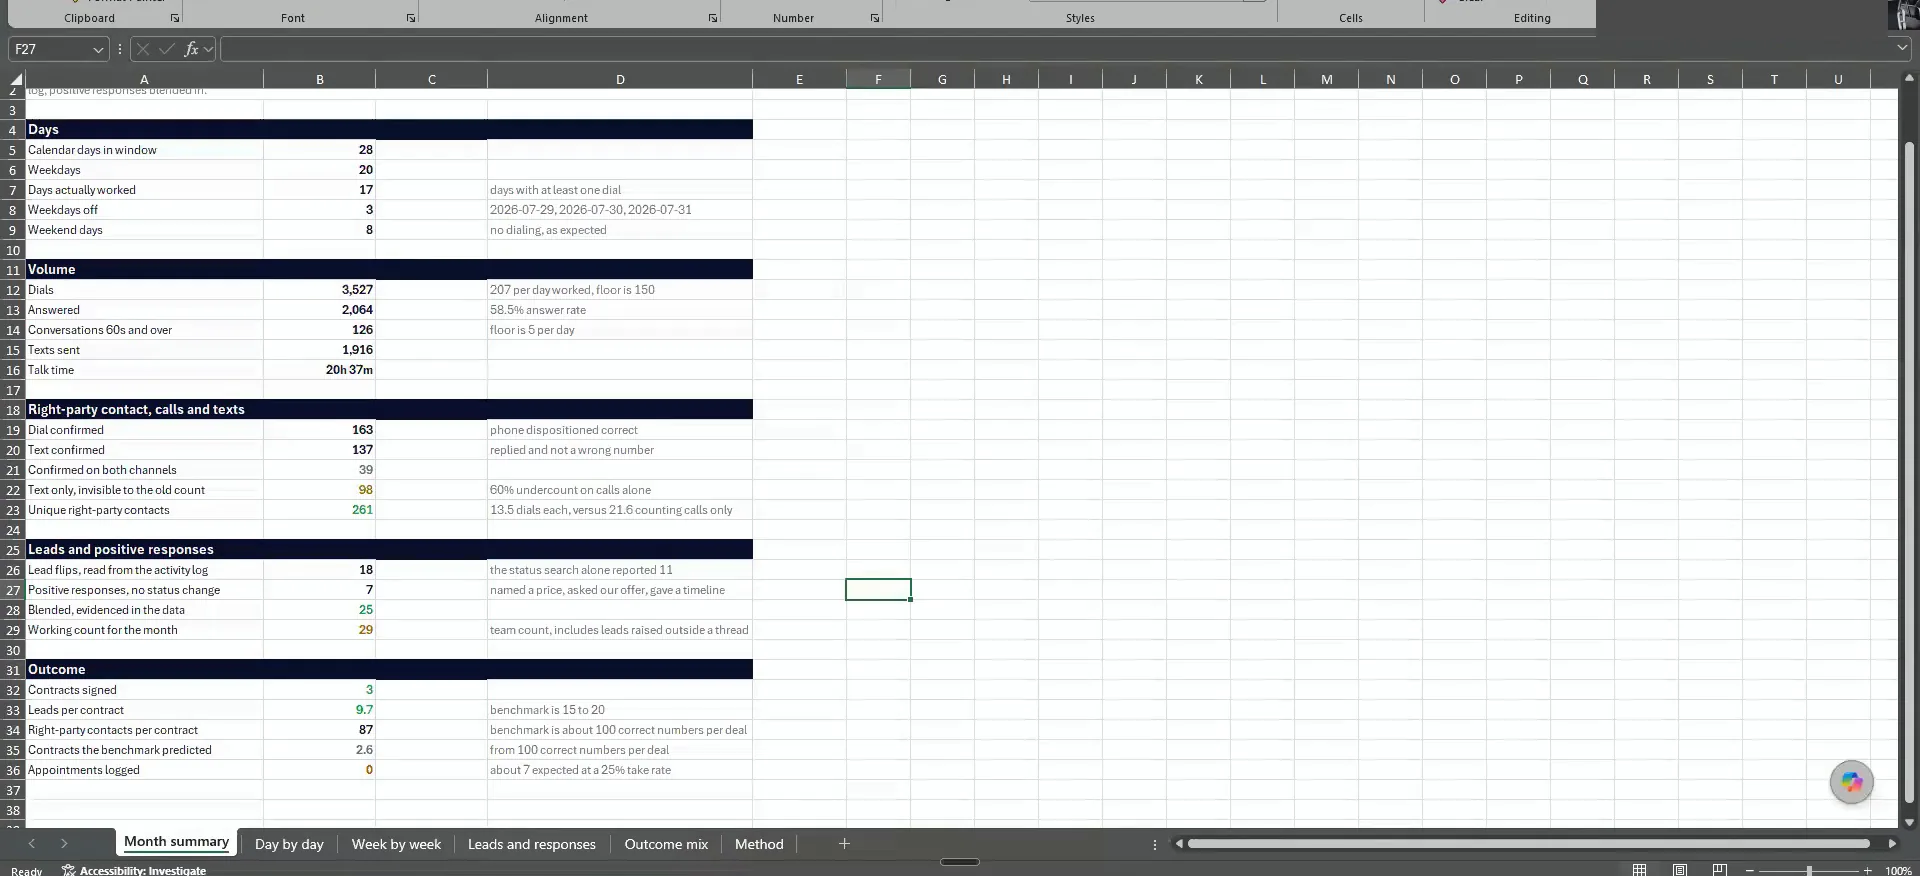
Check what the texting workflow removes before you set volume.
Look at the dial confirmed correct number right party contact next to the text confirmed right party contact. That texting automation is pulling in about half of our correct numbers. That is half the workload that no longer needs to happen for the caller.
You can get through a lot more now if you do all these things, because Trussle will remove 70% of numbers as an example. So the record count one person can handle is much higher than it used to be.
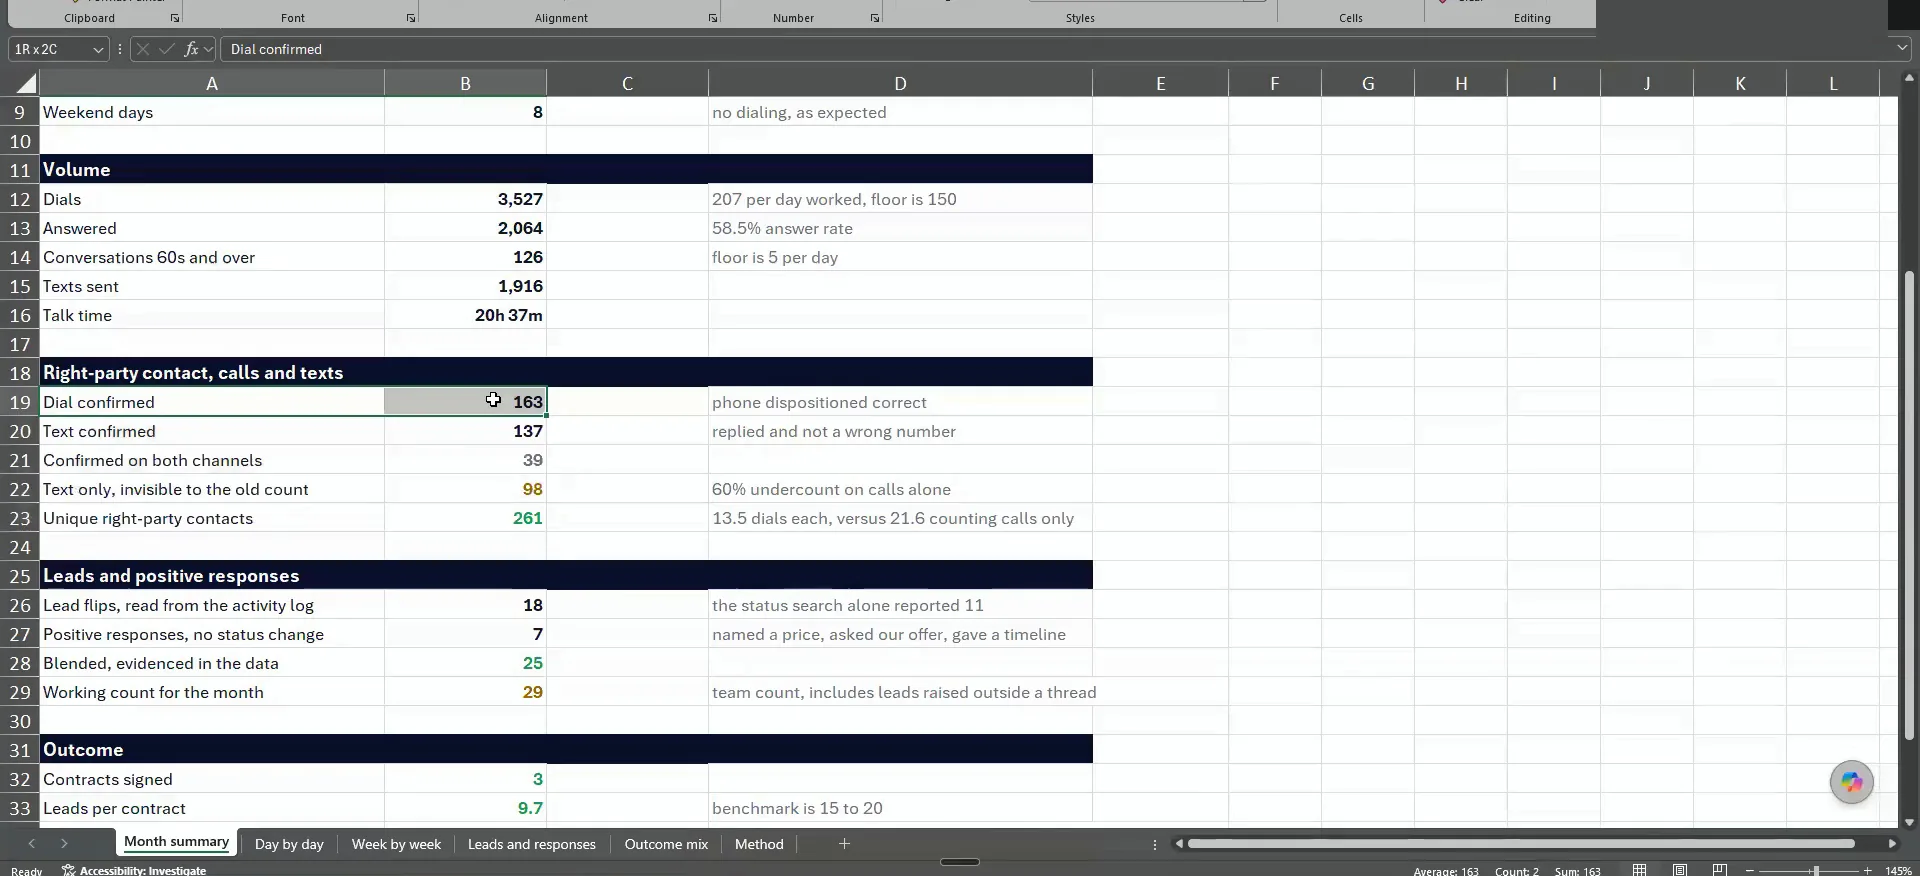
Count records touched, not dials.
Count records touched, not dials, when you size the week.
I think it is somewhere between two fifty to 300 in a week, but I have only been doing this for two weeks. I need to see it shake out for about eight weeks to really know. Before the automated text we were in the 20 to 30 range.
Now it is 30 to 50 records touched, not dials. That is for one person on full scale, and she follows back through the people who don't answer on calls.
So this is exclusively for one person on full scale, 20 numbers and sending out 25 text per number per day.
Caller capacity
What one caller can touch in a week.
Use the text to clean the front end of the data.
We are not calling no matter what. The text messages clean the front end. A lot of people reply wrong number, so we remove those, and the filtration leaves about two numbers per record to call.
So now we know one of those two is probably the owner. Plenty of them also tell us they are not interested by text, in this case 137. If we don't hear back at all, we come back through and dial the remaining number.
Expect the back half of the sequence to be slower.
You will get more calls out at the beginning of the sequence than at the end. In the second half you make fewer calls, but they are higher quality. Day one and two are usually the bad days.
By Thursday and Friday you have cleaned out the not interested and you are on their radar. Those conversations run several minutes. After the last call attempt we put people on an automated text and email campaign every other day.
BEFORE YOU MOVE ON