
PART 1
Set your base criteria in Lake County.
This is where I set the value floor and ceiling, then clean up the property types before anything else. I do it live in Market Finder on Indiana, Lake County. Follow the same order in your own county.
What base criteria means.
Pick the properties you actually want to reach out to.
So think about the values, the buy box, the type of properties you actually wanna reach out to from an asset perspective. It is everything from a characteristic perspective that has to do with pulling that data from Market Finder. It also covers doing all the market analysis with cloud, if that is something you are doing.
That applies if you have access to the API, or if you are using cloud at all. So let's move into more of the market analysis.
Filter to single family first.
Filter to Indiana, Lake County, single family only.
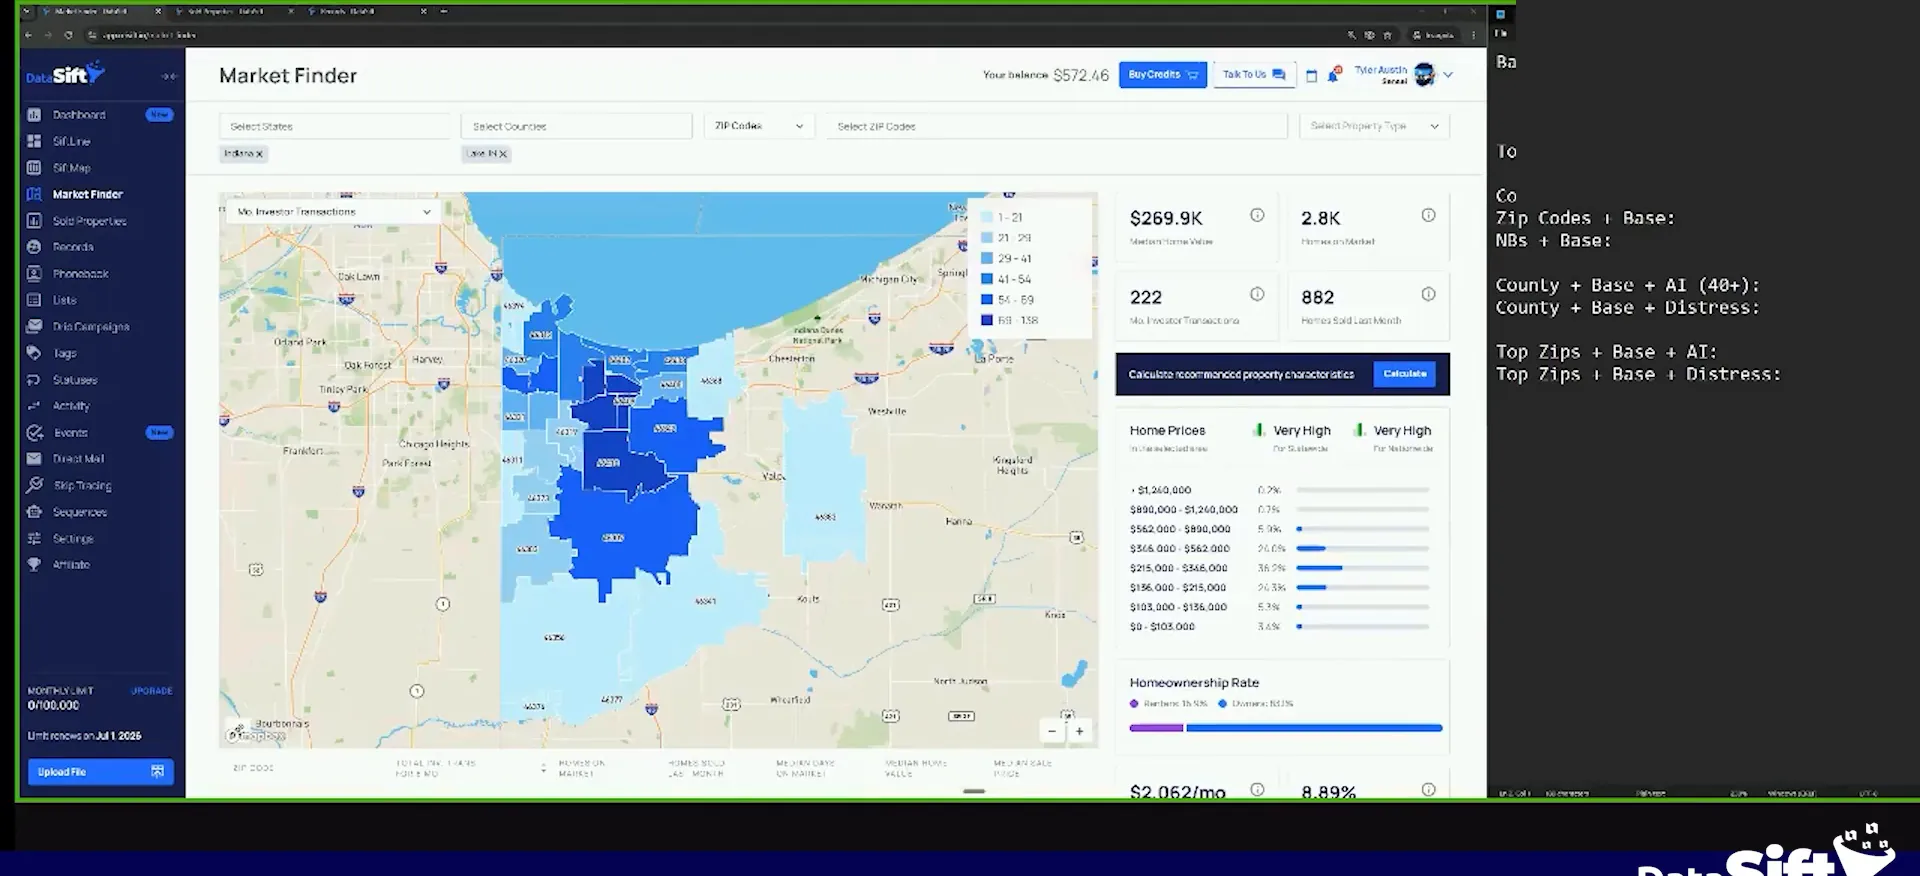
I am filtered by Indiana and Lake County, and I am not selecting any ZIP codes or neighborhoods right now. On the select property tab I make sure I am doing single family, mobile homes and townhouses. I could add multifamily residential, but I do not want to include it here because it can skew things.
If you are going to market the duplexes, triplexes and quads, my recommendation is do not wholesale them. Buy them. For the sake of this training I want to show you how to find flips and wholesale deals. Suppressing down like that also gets rid of the land, and land skews your numbers a bit.
But I am going to, on the select property tab up here, I'm going to go ahead and make sure that I'm doing single family mobile hometown houses.
Cut the bottom 20% and the top 20% of values.
I look at the median home value, how many homes are on the market, monthly investor transactions and homes sold last month. Then I go down to home prices to get an idea of the range of values in that market. We know that $2.72 is the median, so there are properties worth more and properties worth less.
What we do not want is to market only to the top of that threshold and the bottom. We want to be in the middle of that threshold. I used to do 60%. Over the last month and a half I adjusted this to an 80%.
Looking at the bands, I have got three and a half and 5.2, and a little bit of this 23%. So I would focus on about $150,000 properties up to about 475,000. I put in 150 to 450 k AVM, which is like your estimated value. We might adjust that again once we look at our sold properties.
Now the data is how I want it to be.
So we know that $2.72 is the median, which means that there must be properties that are worth more, and there must be properties that are worth less.
Drop the property types to single family residences.
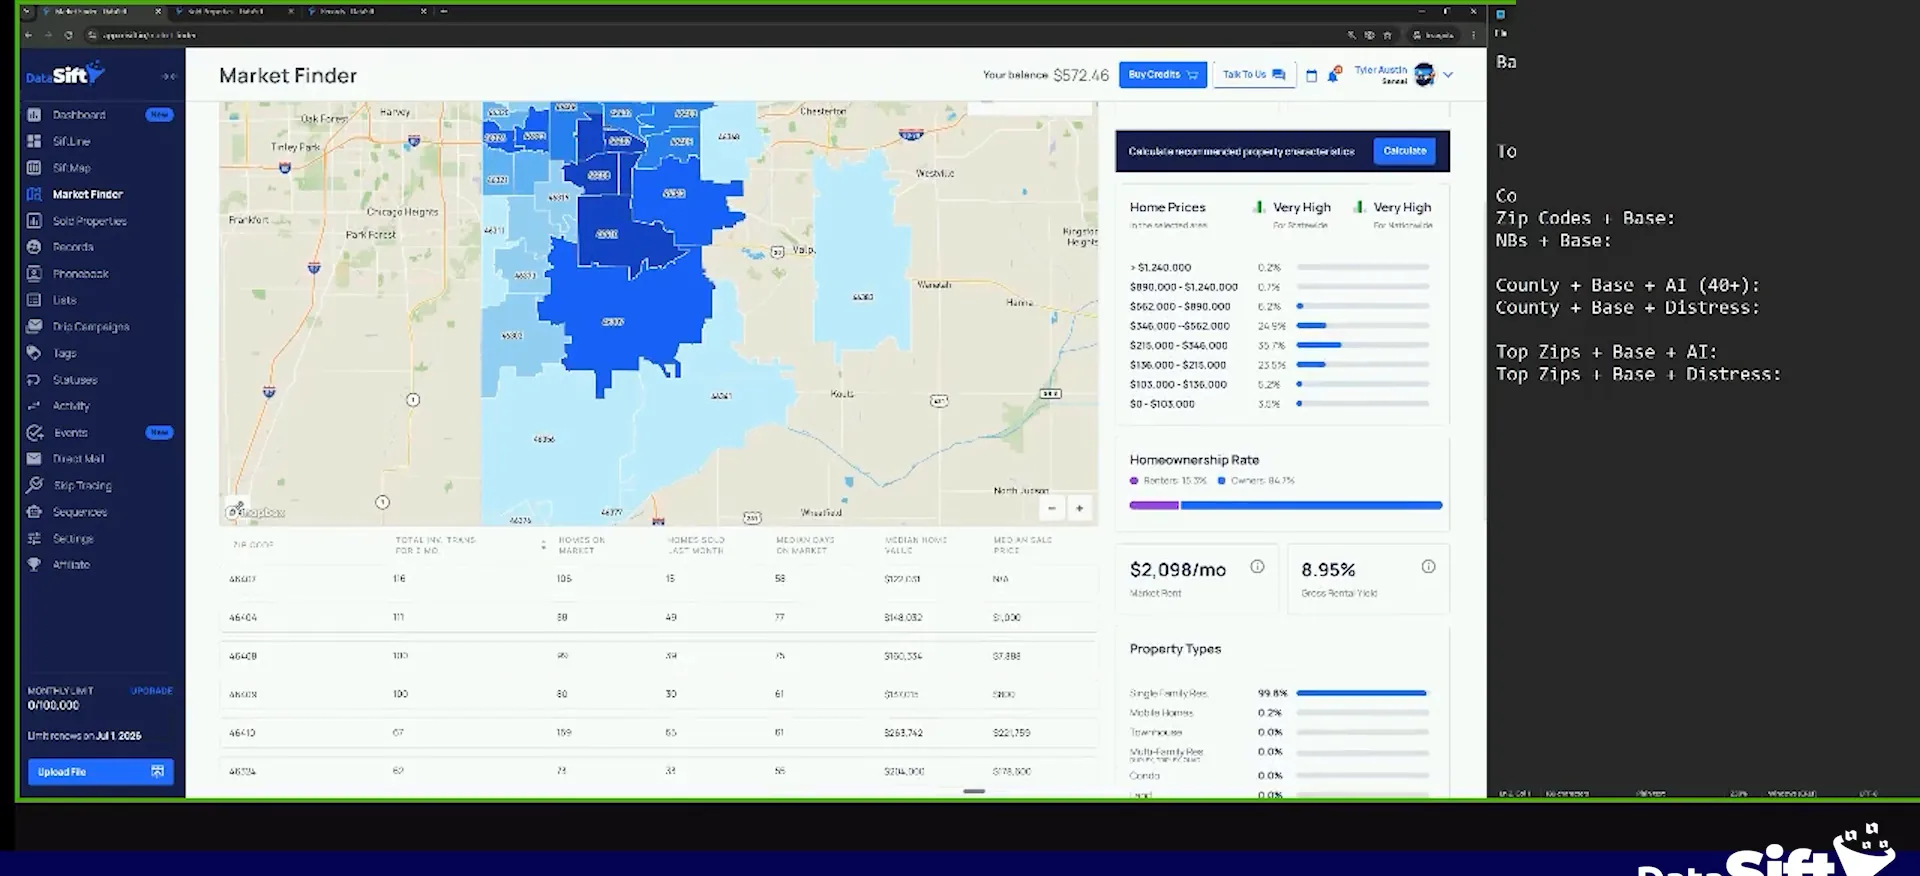
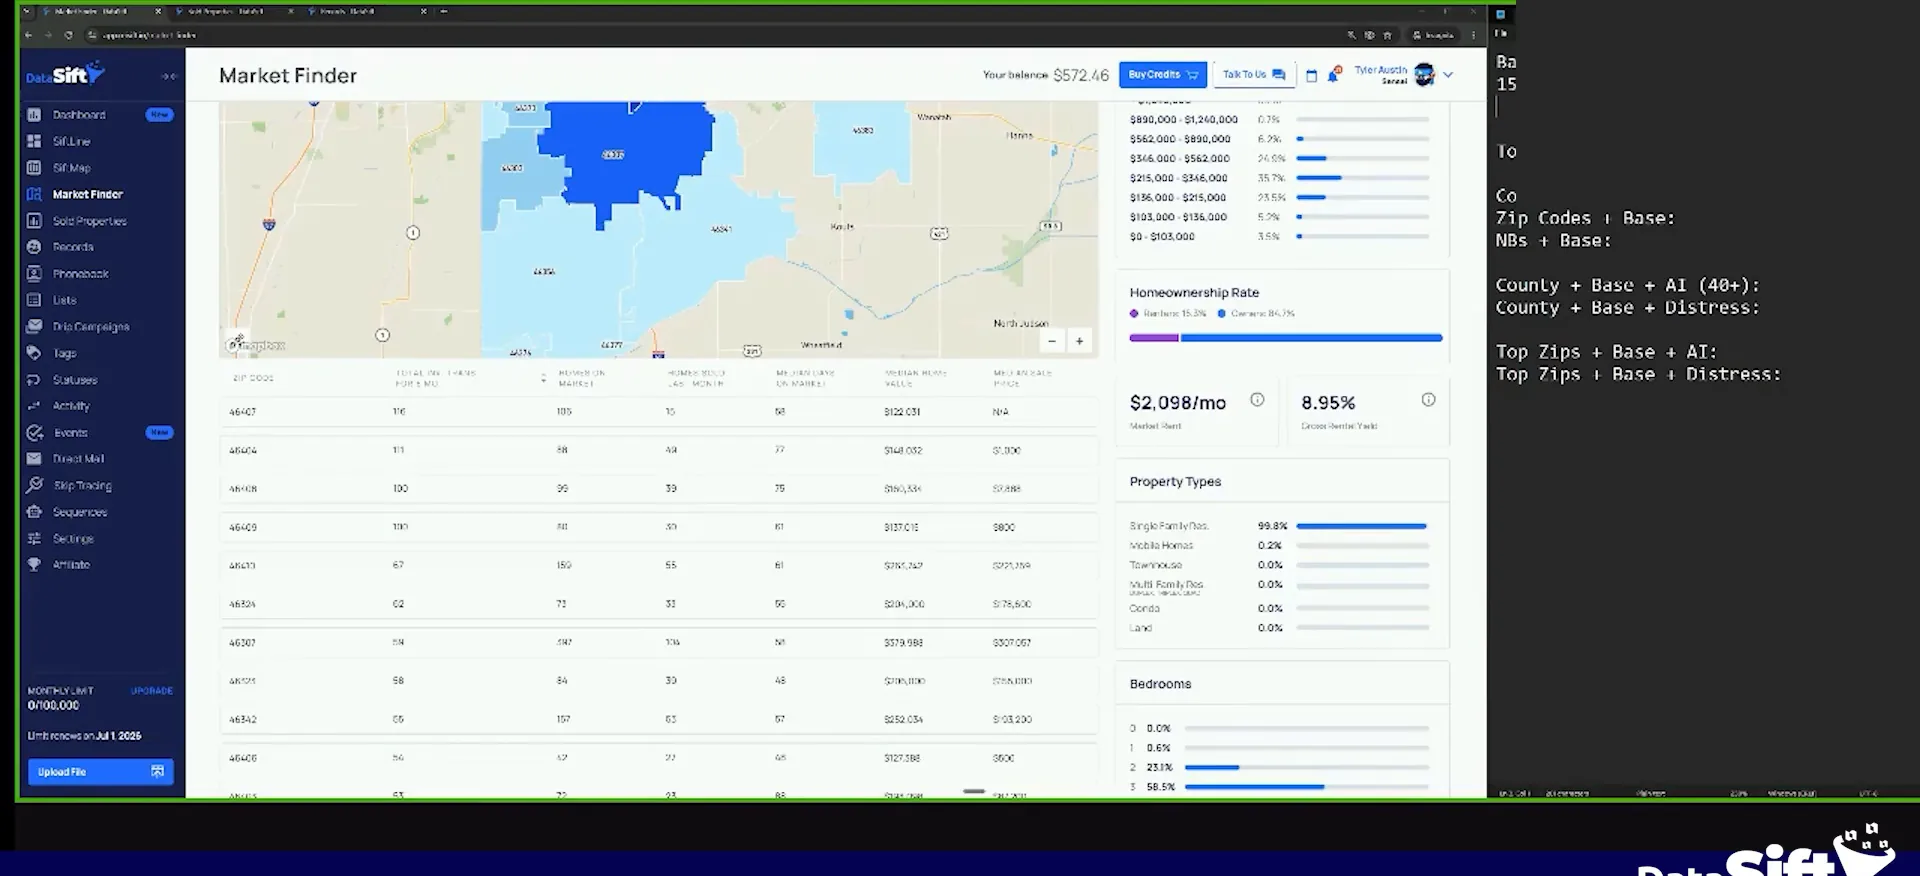
I scroll down a little bit and I can see it is predominantly single family. There are almost no mobile homes here. So I am only going to do single family residences in this market.
That means I can realistically remove those other two and just do single family. The numbers barely change at all.
BEFORE YOU MOVE ON
PART 2
Your base criteria in Lake County.
Now we set the floor and ceiling on value, then year built, then ownership. Beds and baths stay open, and equity stays open on purpose. By the end of this Part the base criteria is built and applied in Sift.
Value, year built, and ownership.
Set single family residence only, 150 to 450,000 in value.
We're gonna say single family residence only, 150 to 450,000 in value. That is the floor and the ceiling for this county. Everything else we set sits on top of that.
Leave beds and baths open.
Beds and baths I don't care about, and I don't filter down by it. From dealing with a lot of customers and running reports against closed transactions, that data just isn't uniform enough to care about. If I'm focusing down in locations, it works its way out anyway.
If I was trying to focus on a size, I would use heated square footage instead. Take a property from 1960 that is a thousand square foot showing two bedroom, one bath. There's a huge chance they converted something to add a third bedroom or a second bathroom.
Set year built 2,010 and older, seven years ownership.
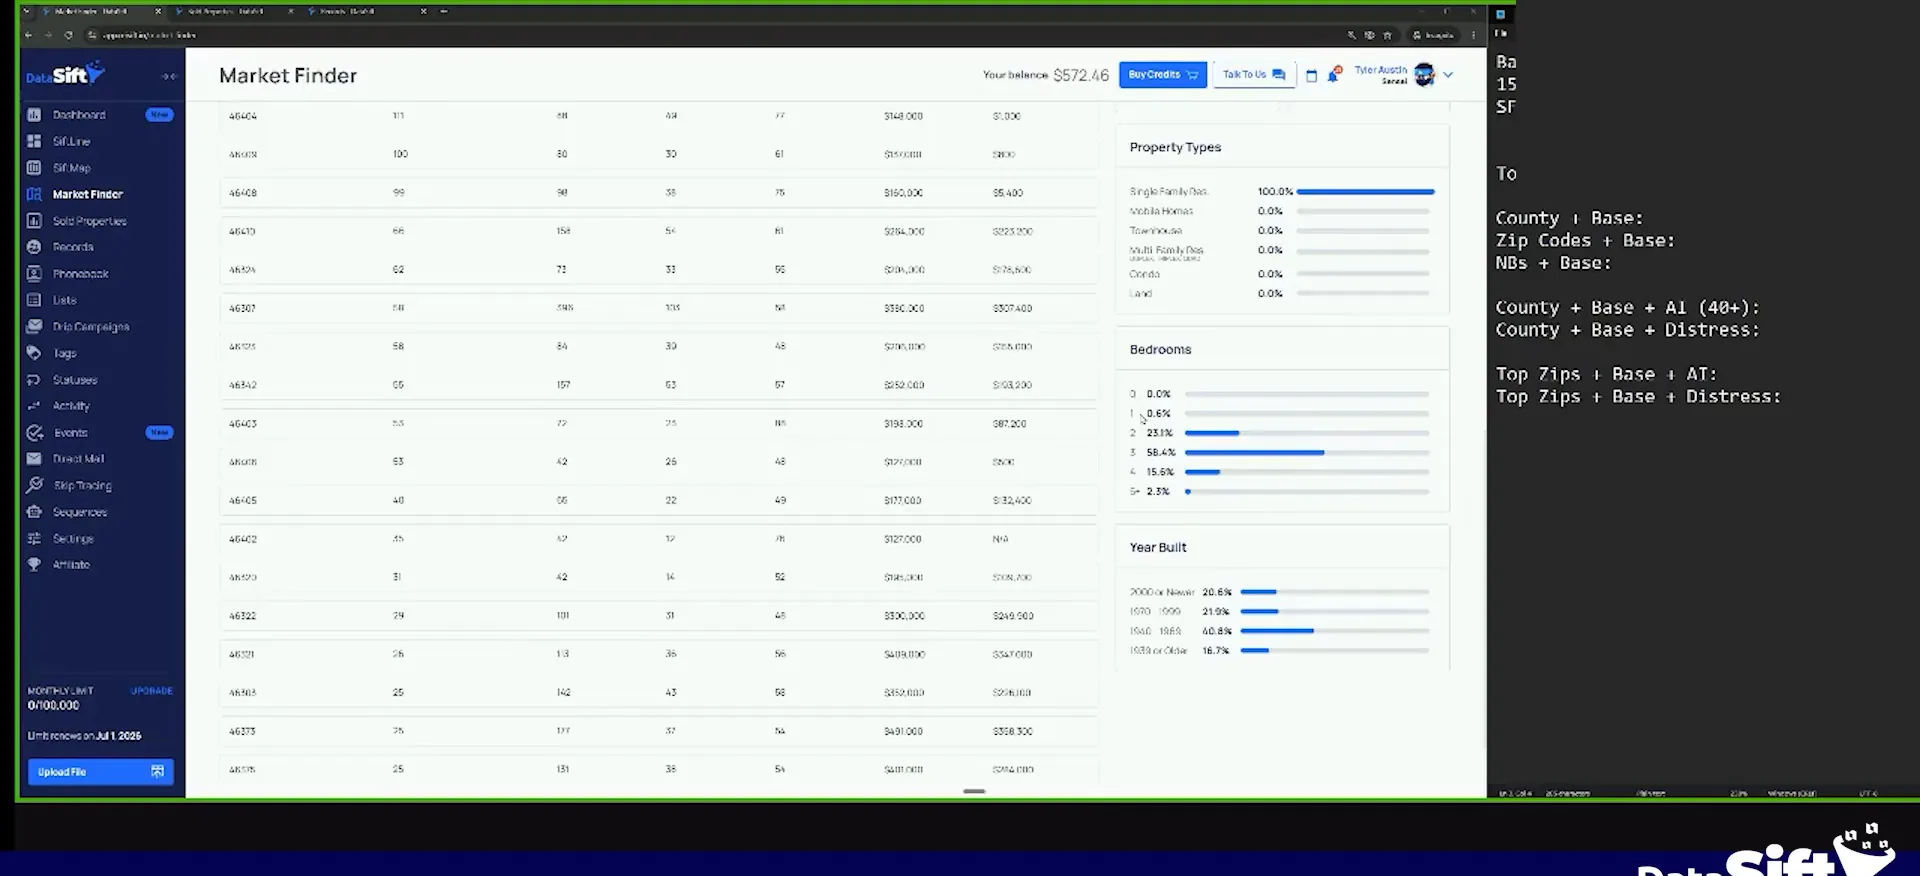
I do care about your built. This market has a lot of old properties, and 2,000 and newer is only 20. So 2,010 and older is plenty here.
Be careful in areas with high investor activity where new construction is going on. With no year requirement you accidentally market to people who just built their house. The ZIP codes themselves will dictate a lot of this anyway.
Then minimum equity. I don't really worry about equity right now, which is a big change since a few of the market analysis videos. I'm just doing years of ownership of seven plus years.
And so I would say 2,010 and older is plenty to get opportunity in that market.
Seven plus years keeps unknown equity.
Use seven plus years ownership instead of an equity filter.
The main reason I do seven plus years of ownership and not the percentage is unknown equity. In my analysis, unknown equity is a very, very great list to have. I used to send direct mail to unknown equity and unknown sale date a lot when I started.
If you do go to a map and you add 30% equity plus five years of ownership, you're eliminating anybody with unknown equity.
Split test seven plus years against less than 30% equity.
The downfall is that I lose the equity check. So I run a split test and look at how many of those records have less than 30% equity. Say it's 20,000 properties and only a small piece of them sit under 30%. Then I don't care.
Most of the time, if it's 20 or 25 equity, I'm gonna be able to do a deal anyway. If it's too many records, just do fewer years of ownership and a 30% equity requirement. A lot of this comes down to how many records you have money to market to.
Check what your unknown sale date records look like.
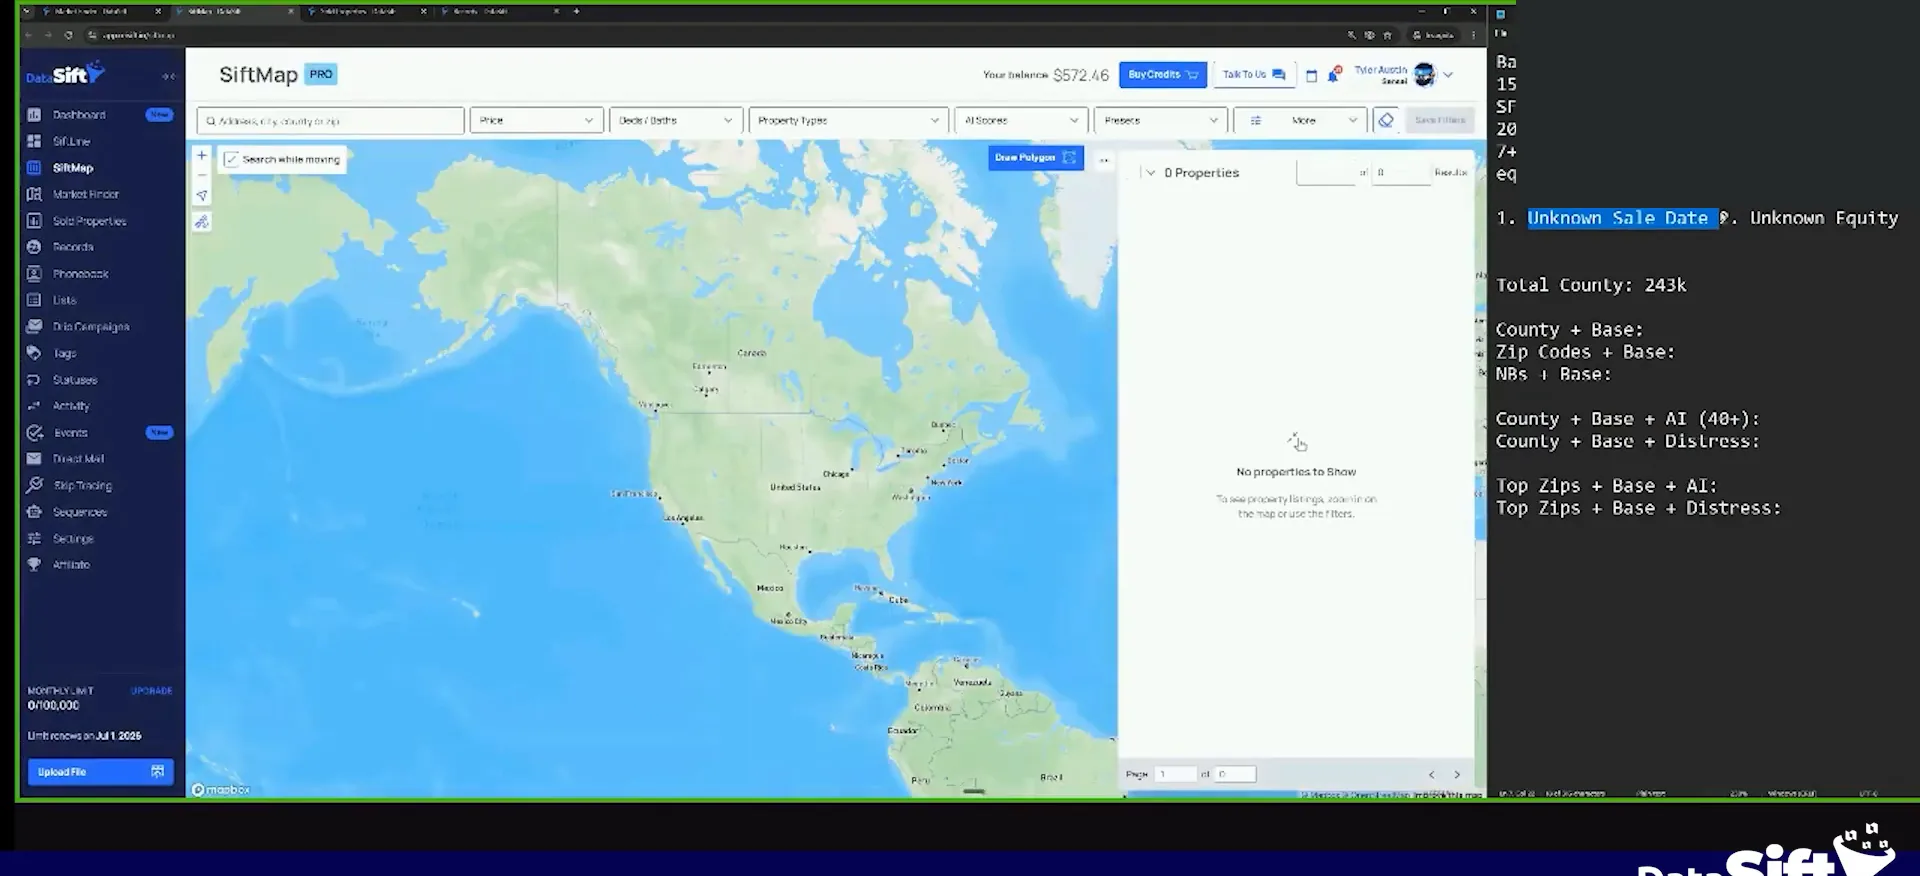
By adding years of ownership, you are missing all of the records that do have an unknown sale date. Check this real quick for your county, because it's all county dependent. With deep understanding comes the ability to manipulate.
A lot of people go start another county, and it's because they don't realize more records exist in a very hot area. They just don't match the filter criteria they've been using in whatever data provider they have. No data provider really educates like this, but it is our thing.
Build the base criteria in Sift.
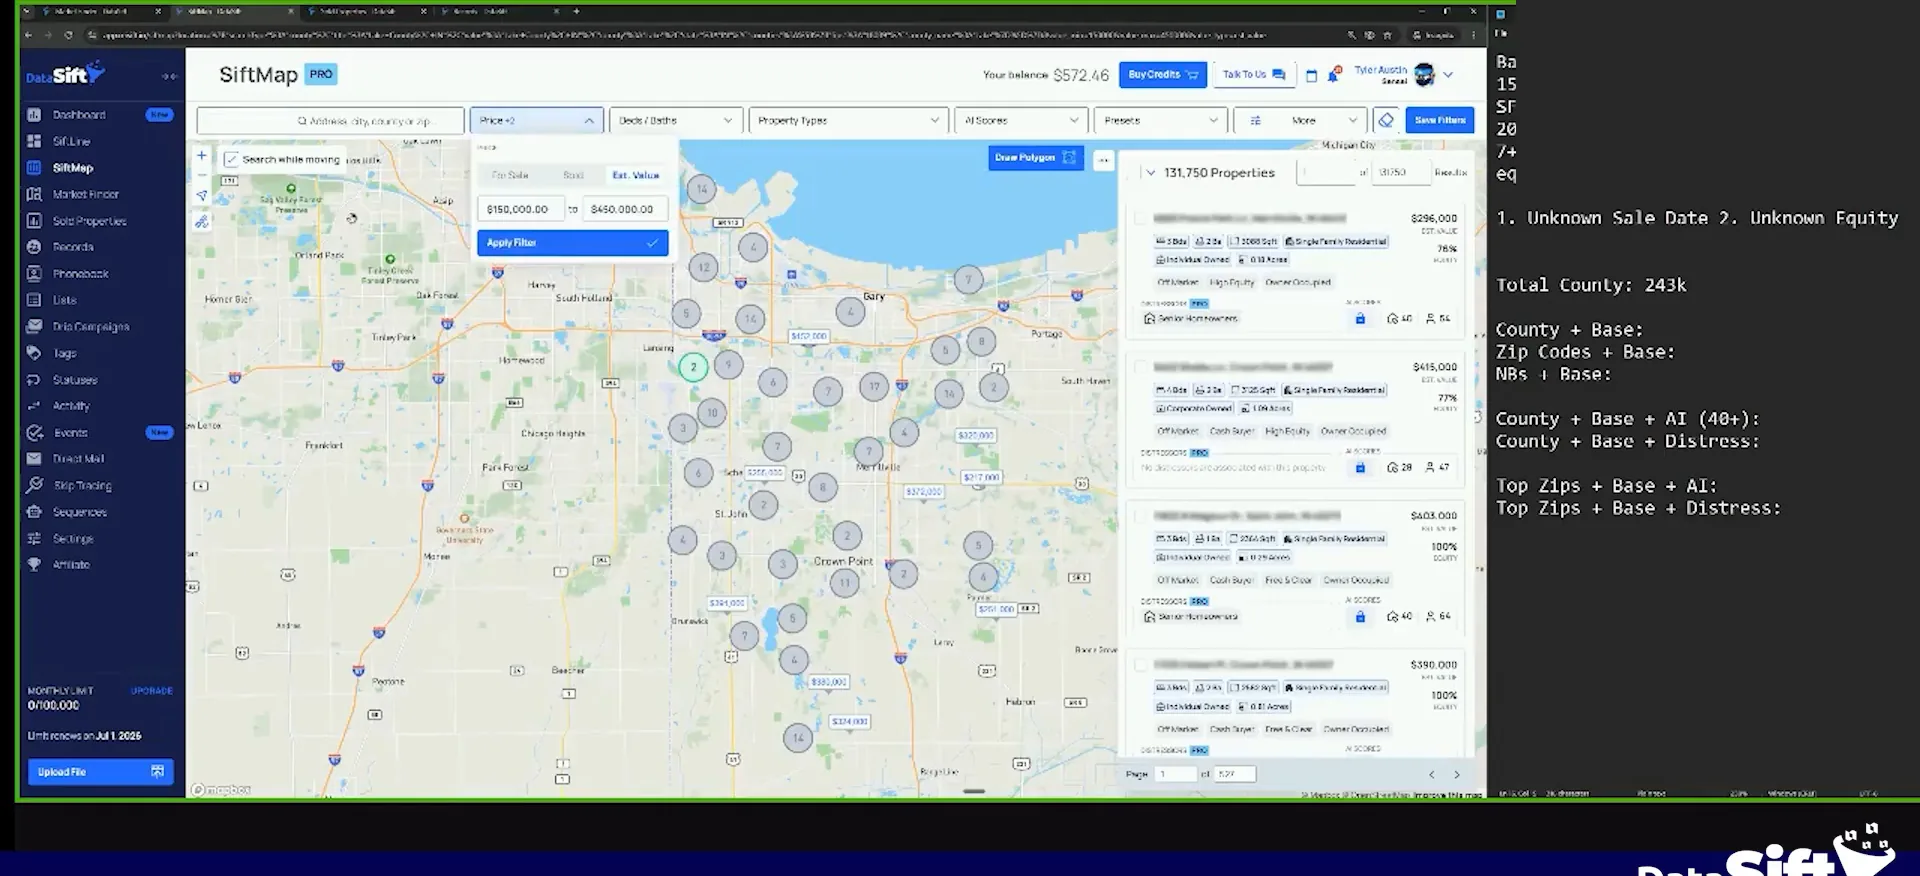
Update the value range to 125 to 475,000 and apply.
I'm filtering in Sift now, and let's just update it to what Claude suggested based on the market analysis. So 125 to 475,000 in value, click apply.
Right now we are still trying to build a really solid base criteria. We haven't picked our ZIP codes yet. In some markets your base criteria alone is a small number of records. Then you just market all of it, because you need the volume.
Look at the neighborhood level before you trust one range.
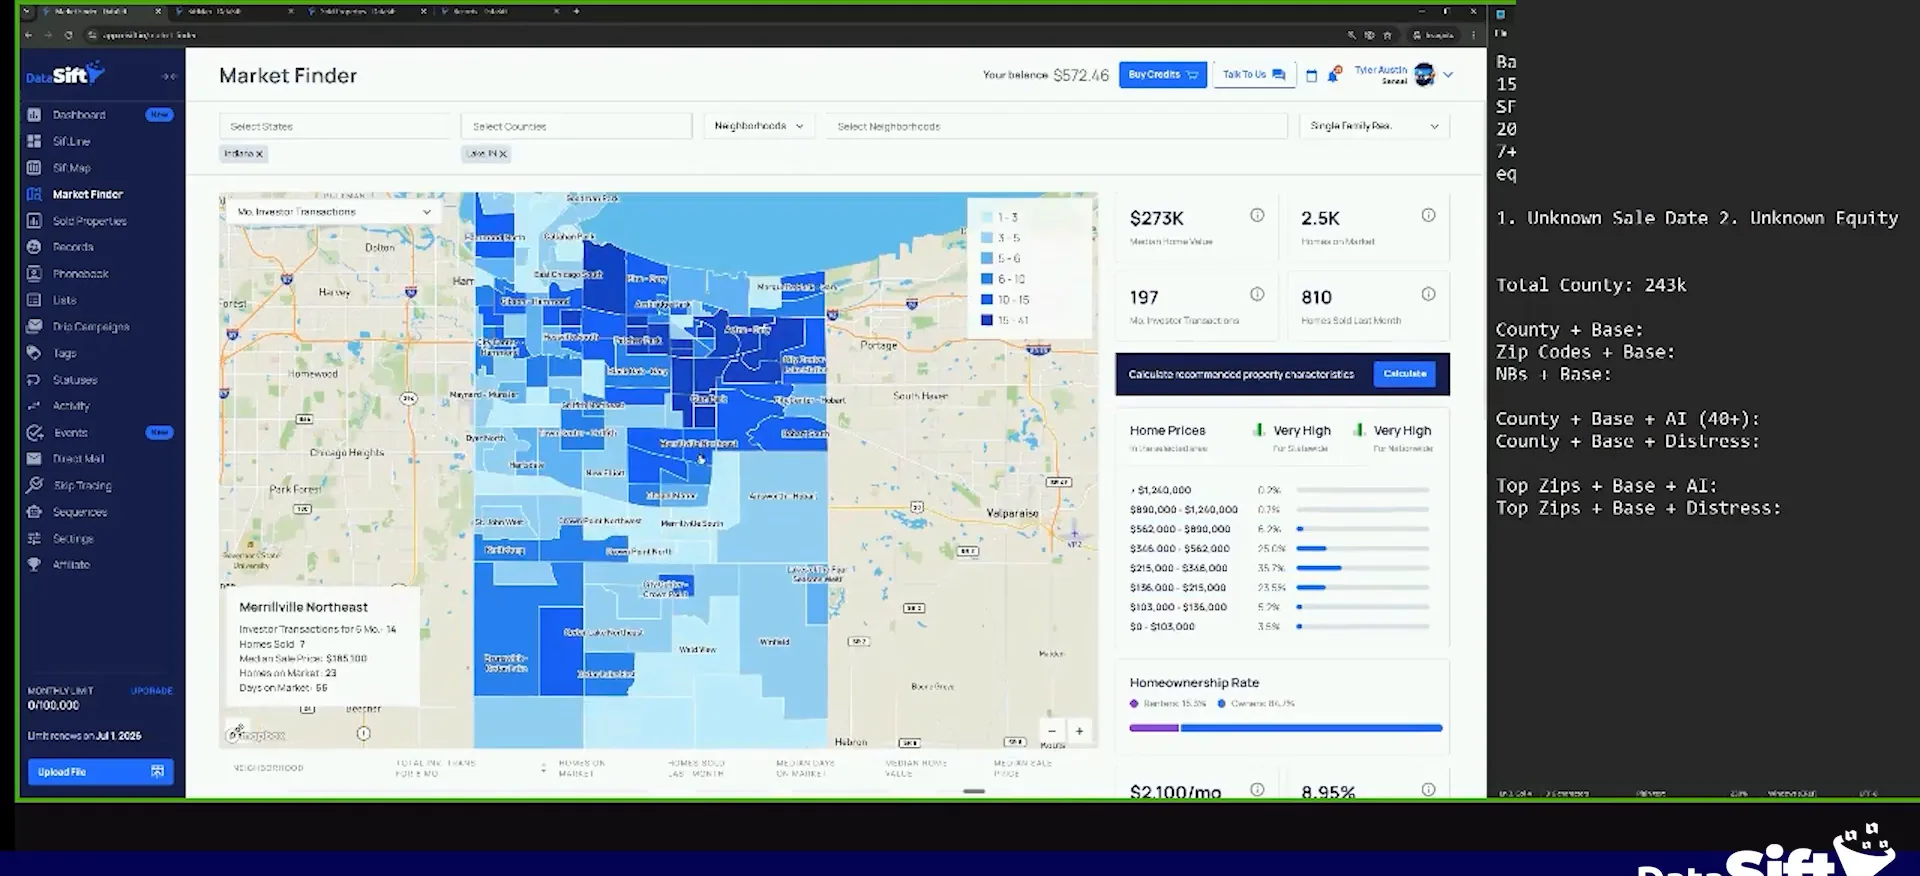
What you can't see from the value range is how it correlates with the ZIP codes and neighborhoods where investor transactions are happening. I just know this market's value ranges sit in that range.
So look at it from a neighborhood level. Most of those areas are around the same, so in this case it's not that big of a deal. One little neighborhood right here is much lower than the rest. It took me a while to debug and figure out the best criteria for my agent, so this gets you close enough.
The median sales price, if you look at the bottom left there in the in the map, is 223,000 in value.
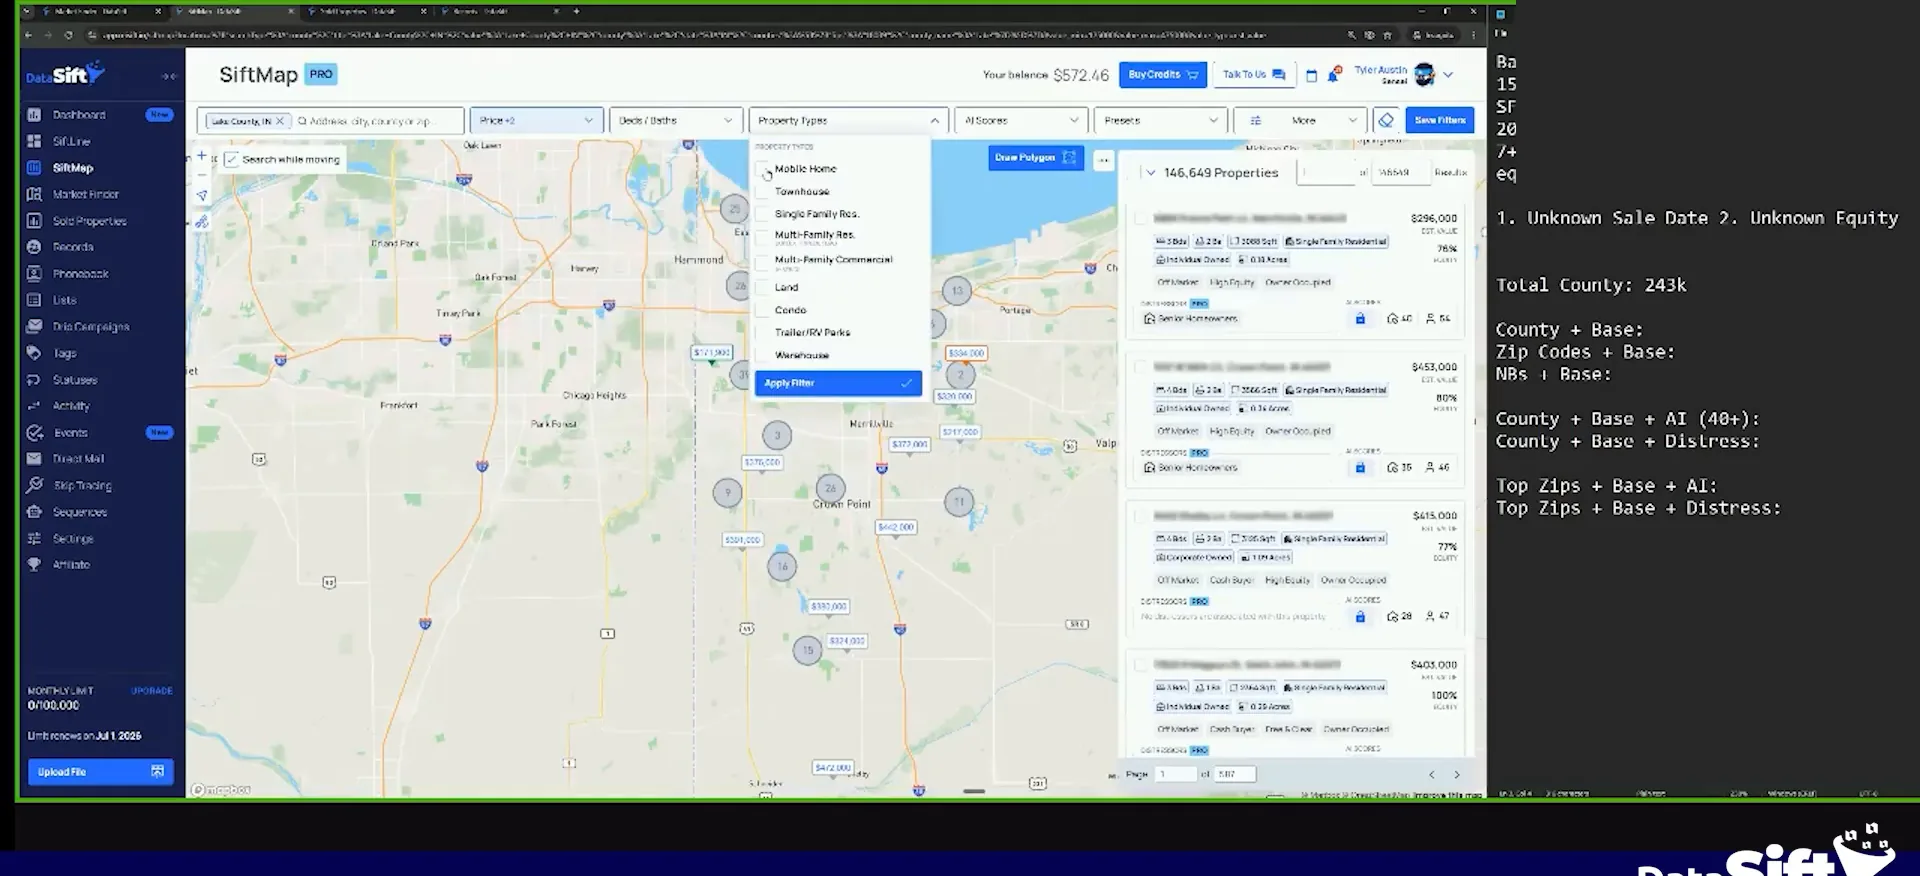
Apply single family, year built, seven years ownership, not listed.
I'm not gonna apply beds and bath. I click more filters, year built, and use the year we set earlier. Then I scroll down to owner details, years of ownership minimum, seven.
Then I scroll down to the MLS filters and say not listed, and click apply. That is the base criteria, and I draw a little line so we know where it ends.
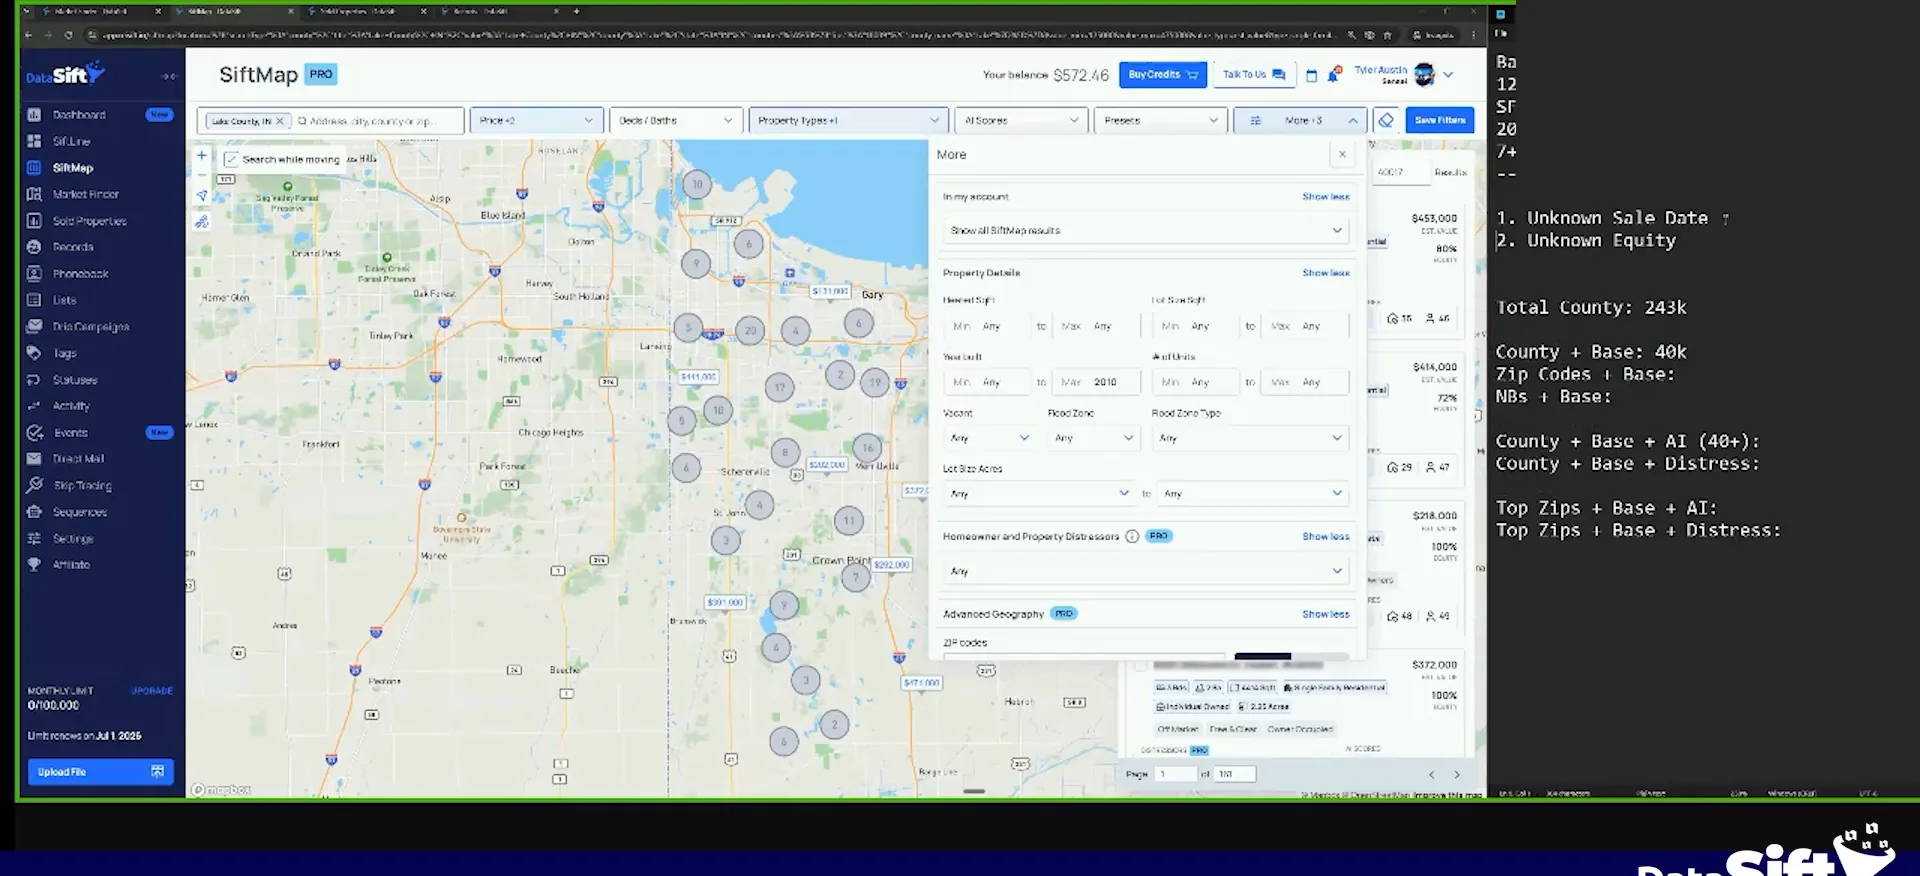
I'm gonna kinda draw a little line here so we know that that's our base criteria, and this is 40 k records.
BEFORE YOU MOVE ON
PART 3
Save your base list filters.
Lake County comes out at forty thousand marketable records with our base criteria. Now we check what the unknown sale date and unknown equity buckets add on top of that. Then we save both filters so we can come back to them later.
Lake County has 40,000 marketable records.
Write down your base criteria record count.
With our standard base criteria inside of Lake County, Indiana, that is the number of records marketable. I put it right here in the notes. Does that mean I cannot market to people above our value ceiling? No, it does not mean that.
It means mostly all of my marketing budget should sit inside the value range we set. That is where most of the actual investor activity is going to be happening. A home above that ceiling in this market would be luxury. I would only go after those with a bit of budget aimed at a targeted neighborhood or ZIP code.
So with our standard base criteria here, inside of Lake County, Indiana, our base criteria is 40,000 records marketable.
Check unknown last sale date with an equity requirement.
Take years of ownership off first. If you are going to do unknown sale date, then you cannot have years of ownership on at the same time. Click unknown last sale date under the pro details and watch the count jump above your base list.
If you are going to do unknown sale date, you do want to add an equity requirement, because it could be a mixture. Put in a minimum and the count barely drops. That is a lot of records.
Why is that the case? The county is bad at what they do and they do not give data properly. A big reason is people who bought land decades ago and hired someone to build the house, so there was never a transaction.
Two base lists
Unknown sale date adds another base list.
Unknown equity adds about two k.
Compare unknown equity against your low equity count.
Remove the equity percentage, toggle unknown equity, and click apply. Unknown equity comes back at two k total. Then I put seven years of ownership back on and look at the low equity end.
Only a thousand of the base records sit under that low equity line. The very lowest equity slice is smaller again, and I am an agent, so I would be fine marketing to those people. Unknown equity is the bigger bucket of the two.
So we'll do seven years of ownership, and then I'm just gonna see how many of these records have less than 29% equity.
Keep the minimum at seven years of ownership.
We want to make sure there is at least a roof that needs replaced, or some other CapEx. That need is what makes a lot of people sell to investors. If they skipped the roof and the AC and the hot water heater, they probably skipped the floors and the kitchen too.
Once he gets some deals under him and wants more marketable properties, adding unknown last sale date is a clear win. It doubles the amount of properties to market to. He may think there are no more deals there, but he did not know the bucket existed.
So that's why for the seven years of ownership, in this case, in his market, most likely with his budget, 40 thousand's totally okay to start with.
The split test
Unknown equity is 2,000 records.
I would stick with doing seven years of ownership.
We cannot quantify the equity percentage.
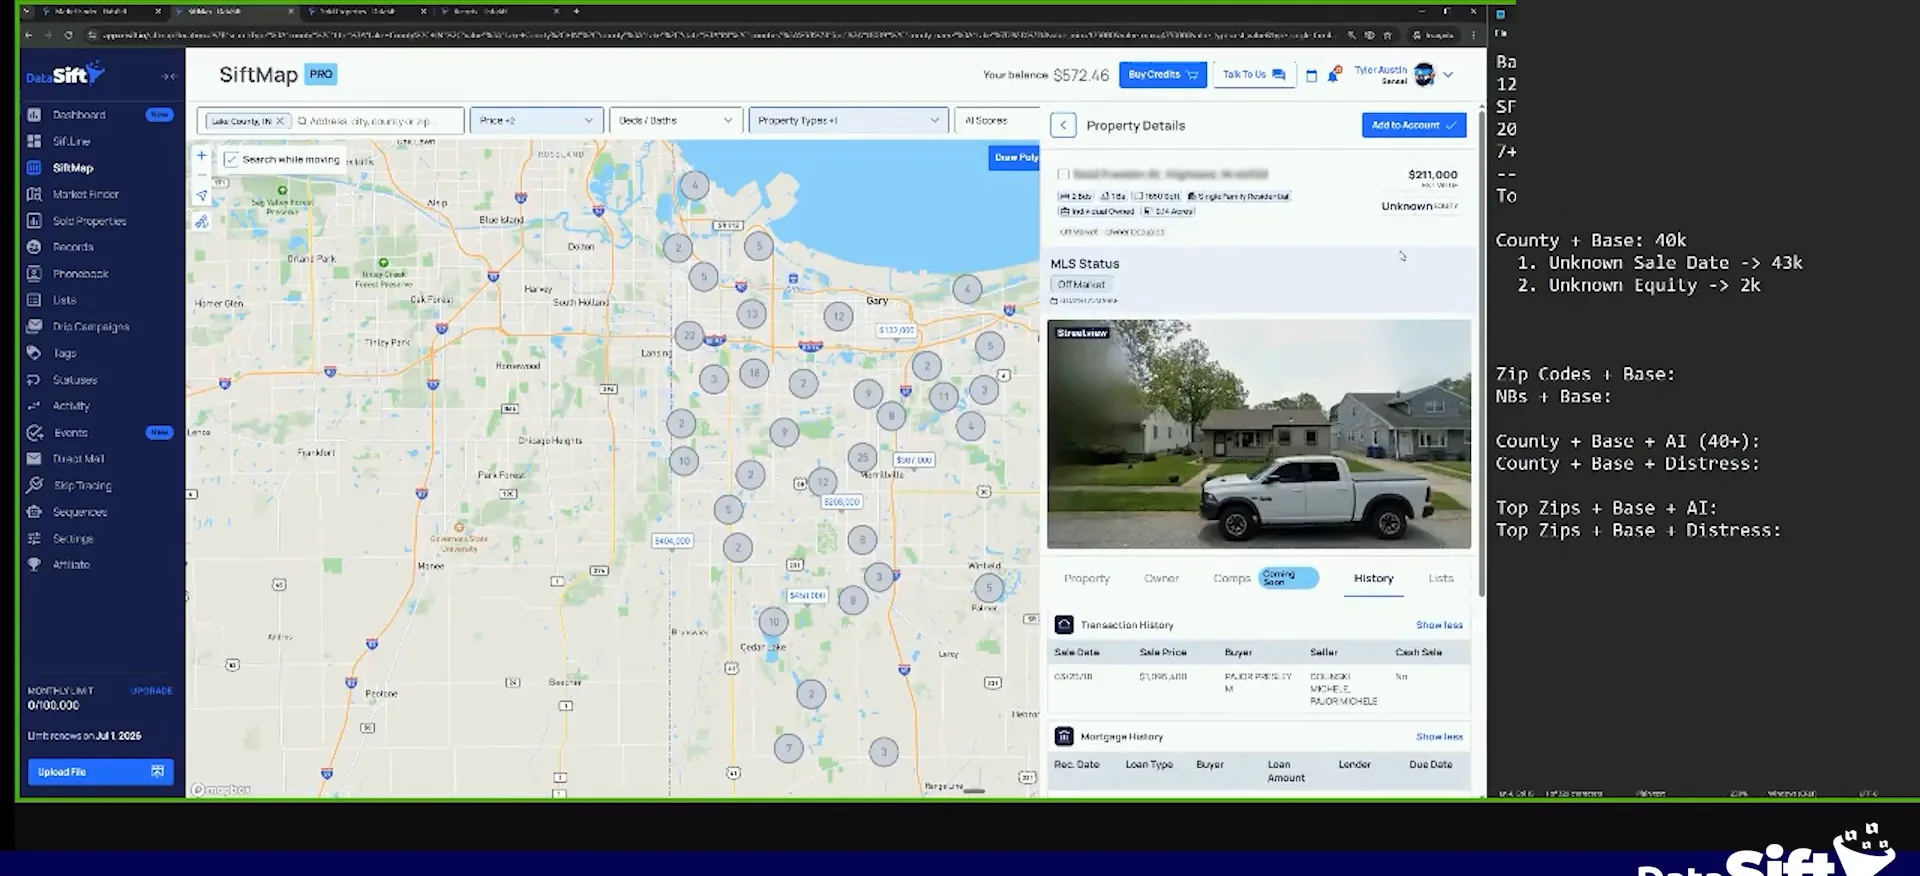
Open the history tab when equity shows unknown.
Look at the history here. We have a mortgage history and we have a sales date, and the equity still comes back unknown. For whatever reason we do not have the equity number.
The only reason we filter by equity as investors is margin. We need enough room in the property to pay closing costs, do the rehab, and still make a profit. So equity is a tool, not the whole answer.
During COVID, we removed equity period because things were appreciating so fast that something that had 20% equity now had 40% equity in some areas.
Save both filters and name them plainly.
Of the 40,000 records with over seven years of ownership, only a thousand had less than 30% equity. So let us simplify the base criteria by just saying seven plus years of ownership. The national average length of ownership nowadays is around five years, which is very low.
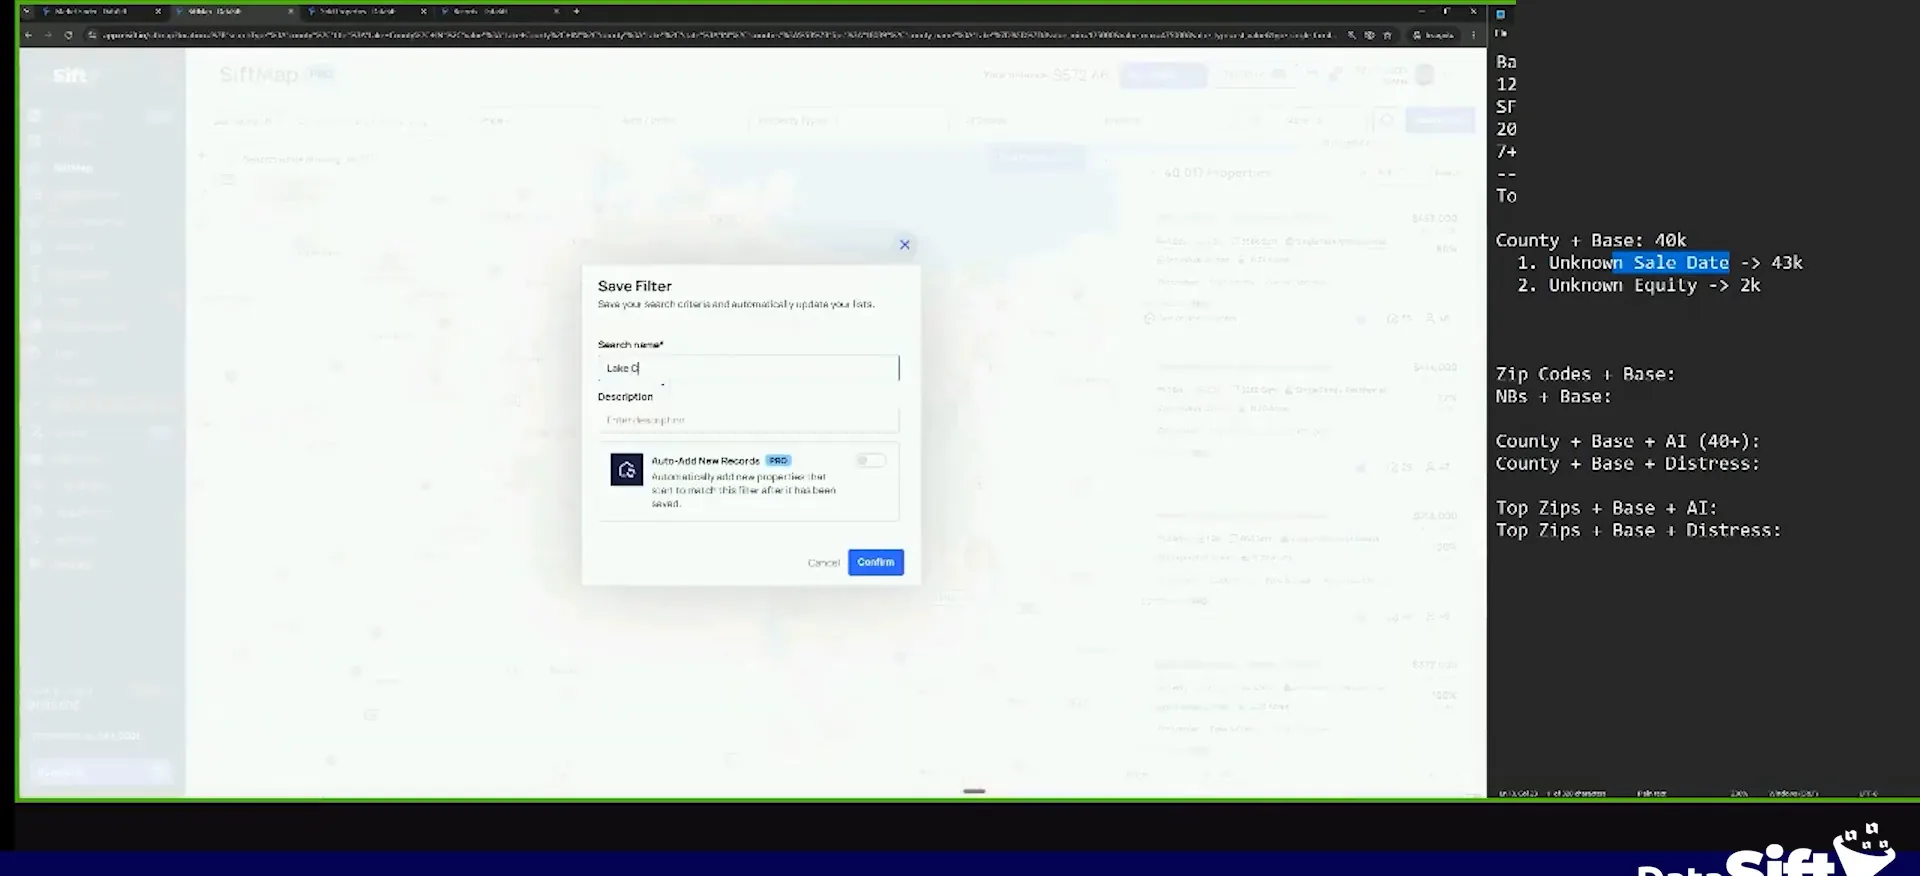
Apply seven years of ownership, save it as a filter, and call it Lake County seven plus years base list. Then remove years of ownership, add the minimum equity, add unknown sale date, and apply. That gives 43,000 records, and I save that as Lake County unknown sale date base list.
Right now you should only really worry about the 40,000 base. I would not worry about the unknown sale date yet. That may change when we start looking at sold properties.
Saved filters
Save both base lists in Lake County.
Right now, you should only really worry about the 40,000 base.
BEFORE YOU MOVE ON